Search
Memory Analysis Patterns
 Multiple Exceptions (user mode) - Modeling Example
 Multiple Exceptions (kernel mode)
 Multiple Exceptions (managed space)
- Multiple Exceptions (stowed)
 Dynamic Memory Corruption (process heap)
 Dynamic Memory Corruption (kernel pool)
- Dynamic Memory Corruption (managed heap)
 False Positive Dump
 Lateral Damage
 Optimized Code
 Invalid Pointer (general)
 NULL Pointer (code)
 NULL Pointer (data)
 Inconsistent Dump
 Hidden Exception (user space)
- Hidden Exception (kernel space)
 Deadlock (critical sections)
 Deadlock (executive resources)
 Deadlock (mixed objects, user space)
 Deadlock (LPC)
 Deadlock (mixed objects, kernel space)
 Deadlock (self)
- Deadlock (managed space)
- Deadlock (.NET Finalizer)
 Changed Environment
 Incorrect Stack Trace
 OMAP Code Optimization
 No Component Symbols
 Insufficient Memory (committed memory)
 Insufficient Memory (handle leak)
 Insufficient Memory (kernel pool)
 Insufficient Memory (PTE)
 Insufficient Memory (module fragmentation)
 Insufficient Memory (physical memory)
 Insufficient Memory (control blocks)
- Insufficient Memory (reserved virtual memory)
- Insufficient Memory (session pool)
- Insufficient Memory (stack trace database)
- Insufficient Memory (region)
 Spiking Thread
 Module Variety
 Stack Overflow (kernel mode)
 Stack Overflow (user mode)
 Stack Overflow (software implementation)
 Managed Code Exception
 Truncated Dump
 Waiting Thread Time (kernel dumps)
 Waiting Thread Time (user dumps)
 Memory Leak (process heap) - Modeling Example
 Memory Leak (.NET heap)
- Memory Leak (page tables)
- Memory Leak (I/O completion packets)
- Memory Leak (regions)
 Missing Thread
 Unknown Component
 Double Free (process heap)
 Double Free (kernel pool)
 Coincidental Symbolic Information
 Stack Trace
- Stack Trace (I/O request)
- Stack Trace (file system filters)
- Stack Trace (database)
- Stack Trace (I/O devices)
 Virtualized Process (WOW64)
 Stack Trace Collection (unmanaged space)
- Stack Trace Collection (managed space)
- Stack Trace Collection (predicate)
- Stack Trace Collection (I/O requests)
- Stack Trace Collection (CPUs)
 Coupled Processes (strong)
 Coupled Processes (weak)
 Coupled Processes (semantics)
 High Contention (executive resources)
 High Contention (critical sections)
 High Contention (processors)
- High Contention (.NET CLR monitors)
- High Contention (.NET heap)
 Accidental Lock
 Passive Thread (user space)
 Passive System Thread (kernel space)
 Main Thread
 Busy System
 Historical Information
 Object Distribution Anomaly (IRP)
- Object Distribution Anomaly (.NET heap)
 Local Buffer Overflow
 Early Crash Dump
 Hooked Functions (user space)
 Hooked Functions (kernel space)
- Hooked Modules
 Custom Exception Handler (user space)
 Custom Exception Handler (kernel space)
 Special Stack Trace
 Manual Dump (kernel)
 Manual Dump (process)
 Wait Chain (general)
 Wait Chain (critical sections)
 Wait Chain (executive resources)
 Wait Chain (thread objects)
 Wait Chain (LPC/ALPC)
 Wait Chain (process objects)
 Wait Chain (RPC)
 Wait Chain (window messaging)
 Wait Chain (named pipes)
- Wait Chain (mutex objects)
- Wait Chain (pushlocks)
- Wait Chain (CLR monitors)
- Wait Chain (RTL_RESOURCE)
- Wait Chain (modules)
- Wait Chain (nonstandard synchronization)
- Wait Chain (C++11, condition variable)
- Wait Chain (SRW lock)
 Corrupt Dump
 Dispatch Level Spin
 No Process Dumps
 No System Dumps
 Suspended Thread
 Special Process
 Frame Pointer Omission
 False Function Parameters
 Message Box
 Self-Dump
 Blocked Thread (software)
 Blocked Thread (hardware)
- Blocked Thread (timeout)
 Zombie Processes
 Wild Pointer
 Wild Code
 Hardware Error
 Handle Limit (GDI, kernel space)
- Handle Limit (GDI, user space)
 Missing Component (general)
 Missing Component (static linking, user mode)
 Execution Residue (unmanaged space)
- Execution Residue (managed space)
 Optimized VM Layout
- Invalid Handle (general)
- Invalid Handle (managed space)
- Overaged System
- Thread Starvation (realtime priority)
- Thread Starvation (normal priority)
- Duplicated Module
- Not My Version (software)
- Not My Version (hardware)
- Data Contents Locality
- Nested Exceptions (unmanaged code)
- Nested Exceptions (managed code)
- Affine Thread
- Self-Diagnosis (user mode)
- Self-Diagnosis (kernel mode)
- Self-Diagnosis (registry)
- Inline Function Optimization (unmanaged code)
- Inline Function Optimization (managed code)
- Critical Section Corruption
- Lost Opportunity
- Young System
- Last Error Collection
- Hidden Module
- Data Alignment (page boundary)
- C++ Exception
- Divide by Zero (user mode)
- Divide by Zero (kernel mode)
- Swarm of Shared Locks
- Process Factory
- Paged Out Data
- Semantic Split
- Pass Through Function
- JIT Code (.NET)
- JIT Code (Java)
- Ubiquitous Component (user space)
- Ubiquitous Component (kernel space)
- Nested Offender
- Virtualized System
- Effect Component
- Well-Tested Function
- Mixed Exception
- Random Object
- Missing Process
- Platform-Specific Debugger
- Value Deviation (stack trace)
- Value Deviation (structure field)
- CLR Thread
- Coincidental Frames
- Fault Context
- Hardware Activity
- Incorrect Symbolic Information
- Message Hooks - Modeling Example
- Coupled Machines
- Abridged Dump
- Exception Stack Trace
- Distributed Spike
- Instrumentation Information
- Template Module
- Invalid Exception Information
- Shared Buffer Overwrite
- Pervasive System
- Problem Exception Handler
- Same Vendor
- Crash Signature
- Blocked Queue (LPC/ALPC)
- Fat Process Dump
- Invalid Parameter (process heap)
- Invalid Parameter (runtime function)
- String Parameter
- Well-Tested Module
- Embedded Comment
- Hooking Level
- Blocking Module
- Dual Stack Trace
- Environment Hint
- Top Module
- Livelock
- Technology-Specific Subtrace (COM interface invocation)
- Technology-Specific Subtrace (dynamic memory)
- Technology-Specific Subtrace (JIT .NET code)
- Technology-Specific Subtrace (COM client call)
- Dialog Box
- Instrumentation Side Effect
- Semantic Structure (PID.TID)
- Directing Module
- Least Common Frame
- Truncated Stack Trace
- Data Correlation (function parameters)
- Data Correlation (CPU times)
- Module Hint
- Version-Specific Extension
- Cloud Environment
- No Data Types
- Managed Stack Trace
- Coupled Modules
- Thread Age
- Unsynchronized Dumps
- Pleiades
- Quiet Dump
- Blocking File
- Problem Vocabulary
- Activation Context
- Stack Trace Set
- Double IRP Completion
- Caller-n-Callee
- Annotated Disassembly (JIT .NET code)
- Handled Exception (user space)
- Handled Exception (.NET CLR)
- Handled Exception (kernel space)
- Duplicate Extension
- Special Thread (.NET CLR)
- Hidden Parameter
- FPU Exception
- Module Variable
- System Object
- Value References
- Debugger Bug
- Empty Stack Trace
- Problem Module
- Disconnected Network Adapter
- Network Packet Buildup
- Unrecognizable Symbolic Information
- Translated Exception
- Regular Data
- Late Crash Dump
- Blocked DPC
- Coincidental Error Code
- Punctuated Memory Leak
- No Current Thread
- Value Adding Process
- Activity Resonance
- Stored Exception
- Spike Interval
- Stack Trace Change
- Unloaded Module
- Deviant Module
- Paratext
- Incomplete Session
- Error Reporting Fault
- First Fault Stack Trace
- Frozen Process
- Disk Packet Buildup
- Hidden Process
- Active Thread (Mac OS X)
- Active Thread (Windows)
- Critical Stack Trace
- Handle Leak
- Module Collection
- Module Collection (predicate)
- Deviant Token
- Step Dumps
- Broken Link
- Debugger Omission
- Glued Stack Trace
- Reduced Symbolic Information
- Injected Symbols
- Distributed Wait Chain
- One-Thread Process
- Module Product Process
- Crash Signature Invariant
- Small Value
- Shared Structure
- Thread Cluster
- False Effective Address
- Screwbolt Wait Chain
- Design Value
- Hidden IRP
- Tampered Dump
- Memory Fluctuation (process heap)
- Last Object
- Rough Stack Trace
- Past Stack Trace
- Ghost Thread
- Dry Weight
- Exception Module
- Reference Leak
- Origin Module
- Hidden Call
- Corrupt Structure
- Software Exception
- Crashed Process
- Variable Subtrace
- User Space Evidence
- Internal Stack Trace
- Distributed Exception (managed code)
- Thread Poset
- Stack Trace Surface
- Hidden Stack Trace
- Evental Dumps
- Clone Dump
- Parameter Flow
- Critical Region
- Diachronic Module
- Constant Subtrace
- Not My Thread
- Window Hint
- Place Trace
- Stack Trace Signature
- Relative Memory Leak
- Quotient Stack Trace
- Module Stack Trace
- Foreign Module Frame
- Unified Stack Trace
- Mirror Dump Set
- Memory Fibration
- Aggregated Frames
- Frame Regularity
- Stack Trace Motif
- System Call
Structural and Behavioral Patterns for Software Diagnostics, Forensics, Prognostics, Root Cause Analysis, Debugging
Our tools are only as good as our pattern language.

Diagnostics Science
Diagnostics is the mother of problem solving.
All areas of human activity involve the use of diagnostics. Proper diagnostics identifies the right problems to solve. We are now a part of a non-profit organization dedicated to the developing and promoting the application of such diagnostics: systemic and pattern-oriented (pattern-driven and pattern-based).
Narrachain
Narrachain is an application of blockchain technology to software narratives, stories of computation, such as traces and logs including generalized traces such as memory dumps. Based on Software Narratology Square it also covers software construction narratives and, more generally, graphs (trees) of software narratives.
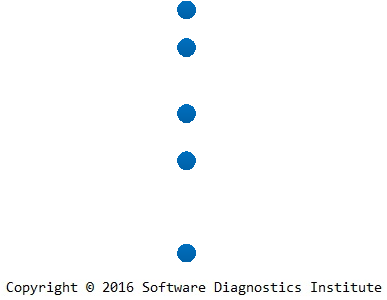
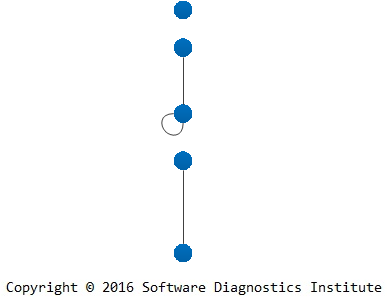
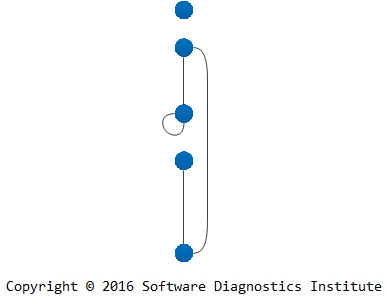
In case of software traces and logs, a blockchain-based software narrative may be implemented by adding an additional distributed trace that records the hash of a message block together with the hash of a previous block (a hash chain). This is depicted in the following diagram where Palimpsest Message appeared after the software narrative was growing for some time:

Performance considerations may affect the size of message blocks.
Narrachains can be used to prevent malnarratives and prove the integrity of software execution artifacts. The novel approach here is an integration of such a technology into a system of diagnostic analysis patterns (for example, problem description analysis patterns, trace and log analysis patterns, memory analysis patterns, unified debugging patterns). Narrascope, a narrative debugger, developed by Software Diagnostics Services, will include the support for NarraChain trace and log analysis pattern as well.
Narrachains can also be used for maintaining integrity of software support workflows by tracking problem information and its changes. For example, changes in problem description or newly found diagnostic indicators trigger invalidation of diagnostic analysis reports and re-evaluation of troubleshooting suggestions.
Book: Accelerated Windows Malware Analysis with Memory Dumps, Second Edition
New! The second edition is available in PDF format from Software Diagnostics Services.
The first edition is also available for SkillSoft Books24x7 subscribers
![]()
The full transcript of Software Diagnostics Services training. Learn how to navigate process, kernel, and physical spaces and diagnose various malware patterns in Windows memory dump files. The course uses a unique and innovative pattern-oriented analysis approach to speed up the learning curve. The training consists of practical step-by-step hands-on exercises using WinDbg, process, kernel and complete memory dumps. Covered more than 20 malware analysis patterns. The main audience is software technical support and escalation engineers who analyze memory dumps from complex software environments and need to check for possible malware presence in cases of abnormal software behavior. The course will also be useful for software engineers, quality assurance and software maintenance engineers, security researchers, malware and memory forensics analysts who have never used WinDbg for analysis of computer memory. The second edition uses the latest WinDbg 10 version and includes malware analysis pattern catalog reprinted from Memory Dump Analysis Anthology volumes.
- Title: Accelerated Windows Malware Analysis with Memory Dumps: Training Course Transcript and WinDbg Practice Exercises, Second Edition
- Authors: Dmitry Vostokov, Software Diagnostics Services
- Publisher: OpenTask (October 2017)
- Language: English
- Product Dimensions: 28.0 x 21.6
- Paperback: 312 pages
- ISBN-13: 978-1908043863

Software Diagnostics Engineering
When analyzing best practices for cloud architectures and corresponding software design and implementation, we realized that telemetry and logging patterns were completely detached from their analysis activities which were not even mentioned when expected. Some unification is needed there for software construction and software post-construction phases related to software diagnostics solutions. We propose to name the unified discipline Software Diagnostics Engineering which has a solid foundation in Theoretical Software Diagnostics we introduced earlier. This discipline is not limited to the cloud and site engineering but encompasses software technologies vertically (full stack software diagnostics) as well as horizontally (IoT devices, mobile and desktop applications, individual servers, clusters, clouds, and fogs). The difference between other diagnostic engineering disciplines is that in software diagnostics we know software internals and can perform operations not possible in technical and medical diagnostics. We use the definition of software diagnostics introduced in the latest seminar as a discipline studying signs of software structure and behavior in software execution artifacts (such as memory dumps, software and network traces and logs) using systemic and pattern-oriented analysis methodologies.
Software diagnostics engineering includes specialized patterns for software diagnostics architecture in addition to software engineering best practices and patterns used to construct software diagnostics components and systems. But it also includes software post-construction best practices and patterns, for example, software data analysis patterns for software execution artifacts such as memory dumps and machine generated logs, as well as security related analysis of network traces, logs and memory. We depict software diagnostics engineering and its theoretical and engineering foundations in the following diagram:

Mathematical Concepts in Software Diagnostics and Software Data Analysis
Various mathematical analogies and metaphors inspired memory and log analysis patterns and some concepts of software diagnostics and software data analysis. We list them in alphabetical order:
• Adjoints, see also
• Braid groups
• Braids, see also
• Categories
• Coalgebras, functors, 2-categories
• Continuous and discontinuous functions
• Curves
• Derivatives, partial derivatives, see also
• Direct sums and products of sets, see also
• Divergence
• Dual categories
• Dynamical systems
• Fiber bundles, see also
• Fibrations
• Fixed points
• Fourier series
• Galois connections
• Graphs
• Injections, surjections, bijections
• Intervals
• Lattices
• Manifolds, gluing
• Maps, see also
• Motives, see also
• Operads
• Orbifolds
• Piecewise linear functions
• Poincaré map, Poincaré section
• Posets
• Presheaves
• Projective spaces
• Quotient groups
• Riemann surfaces, multivalued functions
• Rough sets
• Sheaves
• Step functions
• Surfaces
• Tensors
• Topology
• Ultrametric spaces, p-adic numbers
• Variadic functions
The links to their definitions and examples can be found in the corresponding references. We give the original references to Memory Dump Analysis Anthology where possible, but most of them can also be found in Pattern-Oriented Software Diagnostics Reference books.
Diagnostic Operads
When introducing software data codiagnostics we mentioned artifact transformations through data analysis patterns. Such analysis patterns were devised for human-assisted data diagnostics (for example, software log analysis) and may be too coarse and high-level for formalization and software implementation. Some of them may be split into more elementary transformations which are composable in an associative way. Some may have multiple artifact inputs and additional parameters. All these suggested a name for such transformations based on the analogy with operads in mathematics: a diagnostic operad. However, this name is a different portmanteau of "operations" and "diagnostics". "Historically, the theoretical study of compositions of operations appeared in the 1950s in the work of Michel Lazard as analyseurs"*.
The preliminary definition for our purposes is:
A diagnostic operad is a sequence of diagnostic operations required to extract diagnostic indicators in a diagnostic process described by diagnostic analysis patterns.
Such a sequence may involve operations from different analysis patterns. This is illustrated in the following diagram:

The operadic approach resembles Elementary Analysis Patterns introduced earlier for memory artifact analysis, but the latter include operations which do not transform or query artifacts. Perhaps diagnostic operads should include some of such operations formalized in a way to make them applicable to other types of artifacts such as logs.
* Jean-Louis Loday, Bruno Vallette, Algebraic Operads, page vii (ISBN: 978-3642448355)
Resume and CV as Memory Analysis Artifacts and General Traces
Ultimately, writing Resume and CV is a memory analysis activity with similar memory analysis patterns used. The composed artifacts can be considered as general traces and are analyzed by recruiters and prospective employers for structural and behavioral signs (not necessarily abnormal). This is similar to using trace and log analysis patterns to find positive software behavior characteristics, for example, in performance analysis. Writing resumes and curricula vitae as well as their analysis can be further analyzed.
Since many memory analysis patterns are tool independent we provide two resume examples:
Pattern-Oriented Software Diagnostics Reference
Click on an individual book to see its description and table of contents:


Pattern-oriented software diagnostics, uniquely systematic and multidisciplinary, is the new approach in a long time. Described as the unified field theory of software diagnostics, It encompasses and expands the whole field, offers a wider range of software diagnostic possibilities, gives the novel lens to software diagnosis including specific guidelines for the dauntingly complex world of software problems. This 2,300-page reference set should be on a desk of every software engineer and software support problem solver. It includes:
- Encyclopedia of Crash Dump Analysis Patterns, Second Edition
- Software Trace and Log Analysis: A Pattern Reference, Second Edition
- Theoretical Software Diagnostics: Collected Articles
- Software Diagnostics: The Collected Seminars
- Principles of Memory Dump Analysis: The Collected Seminars
- Access to Software Diagnostics Library
You can buy this reference set from Software Diagnostics Services with a discount and also get free access to Software Diagnostics Library.
The Most Important Skill in Software Diagnostics
Browsing through the pile of the “old” unread Communications of the ACM magazines we found an article “A Closer Look at Attention to Detail” about “another non-technical skill fundamental to success in IT beyond communications, interpersonal, and leadership skills” (Communications of the ACM July 2005/Vol. 48. No. 7, pp. 87 – 92).
The reason why it caught our attention was that we already thought about it in the context of software diagnostics, initially as various common mistakes, anti-patterns, and style. Some of these can be considered as attention to detail patterns (ATDP), and we are working on the attention to detail pattern catalog.
Although according to the article, some view this skill as a personal quality and some as a skill that can be improved, we view it as a general skill everyone has but with varying domain dependent levels. It can be taught if its level is very low and improved if already present. Individuals have degrees of this skill depending on a domain of activity: for example, a person may be good at business or people management attention to detail but somewhat lack that skill when it comes to technical matters and vice versa. So domain specific facets of that skill may be improved over time through training and self-education and reinforced via auditing feedback. This is especially true in software support environments that require a different skill set than software engineering.
Analysis pattern orientation facilitates this attention to detail through various pattern catalogs and checklists from software execution artifact collection to writing diagnostic analysis reports including analysis audits.
The ACM article also lists various definitions and views of attention to detail from quality, accuracy, correctness, “not overlooking anything” and conscientiousness to “a firm grasp of what’s going on”. Here, for the latter, pattern orientation applied to software internals may help too.
Regarding the importance of attention to detail (ATD), we would like to quote the referenced ACM article: “ATD is most important in the analyst role where ‘the details’ are analyzed and evaluated. The challenge is frequently putting details in context and knowing what needs to be analyzed and when enough analysis has been completed”.
We also think that organizations that don’t emphasize this skill are not good at attention to detail.
Book: Advanced Windows Memory Dump Analysis with Data Structures, Third Edition
The following direct links can be used to order the book now:
Buy Kindle version from Amazon
New! The third edition is also available in PDF and EPUB formats from Software Diagnostics Services.
The third edition is available for Safari Books Online subscribers
![]()
The second edition is available for SkillSoft Books24x7 subscribers
![]()
The full transcript of Software Diagnostics Services training course with 12 step-by-step exercises, notes, and selected questions and answers. Learn how to navigate through memory dump space and Windows data structures to diagnose, troubleshoot and debug complex software incidents. The training uses a unique and innovative pattern-oriented analysis approach to speed up the learning curve. It consists of practical step-by-step exercises using WinDbg to diagnose structural and behavioral patterns in 64-bit kernel and complete (physical) memory dumps. Additional topics include memory search, kernel linked list navigation, practical WinDbg scripting, registry, system variables and objects, device drivers and I/O. Prerequisites are basic and intermediate level Windows memory dump analysis: the ability to list processors, processes, threads, modules, apply symbols, walk through stack traces and raw stack data, diagnose patterns such as heap corruption, CPU spike, memory leaks, access violation, wait chains and deadlocks. If you don't feel comfortable with prerequisites then Accelerated Windows Memory Dump Analysis training book is recommended before purchasing and reading this book course. Audience: Software technical support and escalation engineers, system administrators, security researchers, reverse engineers, malware and memory forensics analysts, software developers and quality assurance engineers. The 3rd edition was fully reworked to use WinDbg 10 and now covers memory dumps from Windows 10 x64. It includes additional examples from Microsoft Debugging Extension (MEX). 2 new exercises were added: for JavaScript WinDbg scripting and for storage and file system filters. It also includes optional legacy exercises from the previous editions covering Windows Vista.
- Title: Advanced Windows Memory Dump Analysis with Data Structures: Training Course Transcript and WinDbg Practice Exercises with Notes, Third Edition
- Authors: Dmitry Vostokov, Software Diagnostics Services
- Publisher: OpenTask (June 2017)
- Language: English
- Product Dimensions: 28.0 x 21.6
- Paperback: 371 pages
- ISBN-13: 978-1908043849

Memory Dump Analysis Anthology, Volume 10
The following direct links can be used to order the book now:
Buy Paperback or Kindle from Amazon
Buy Paperback from Barnes & Noble
Buy Paperback from Book Depository
Also available in PDF format from Software Diagnostics Services
This reference volume consists of revised, edited, cross-referenced, and thematically organized selected articles from Software Diagnostics Institute (DumpAnalysis.org + TraceAnalysis.org) and Software Diagnostics Library (former Crash Dump Analysis blog, DumpAnalysis.org/blog) about software diagnostics, root cause analysis, debugging, crash and hang dump analysis, software trace and log analysis written in October 2016 - May 2017 for software engineers developing and maintaining products on Windows platforms, quality assurance engineers testing software, technical support and escalation engineers dealing with complex software issues, security researchers, reverse engineers, malware and memory forensics analysts. This volume is fully cross-referenced with volumes 1 – 9 and features:
- 15 new crash dump analysis patterns
- New Linux core dump analysis pattern
- 18 new software trace and log analysis patterns
- Introduction to topological software trace and log analysis
- Introduction to software diagnostic spaces as general graphs of software narratives
- Software diagnostics as archaeology
- Introduction to pattern-oriented diagnostic analysis process
- Principles of pattern-oriented software data analysis
- Abstract debugging commands (ADC) initiative
- Introduction to elementary analysis patterns and reduction of analysis pattern complexity
- Introduction to categorical foundations of software diagnostics
- Introduction to existential prognostics and periodic table of diagnostic patterns
- Introduction to software codiagnostics
- Volume index of memory dump analysis patterns
- Volume index of trace and log analysis patterns
Product information:
- Title: Memory Dump Analysis Anthology, Volume 10
- Authors: Dmitry Vostokov, Software Diagnostics Institute
- Language: English
- Product Dimensions: 22.86 x 15.24
- Paperback: 168 pages
- Publisher: OpenTask (May 2017)
- ISBN-13: 978-1-908043-85-6

Advanced Software Diagnostics and Debugging Reference
Memory Dump Analysis Anthology contains revised, edited, cross-referenced, and thematically organized selected articles from Software Diagnostics Institute and Software Diagnostics Library (former Crash Dump Analysis blog) about software diagnostics, debugging, crash dump analysis, software trace and log analysis, malware analysis, and memory forensics. Its ten volumes in 12 books have more than 4,000 pages and, among many topics, include more than 350 memory analysis patterns (mostly for WinDbg Windows debugger with selected Mac OS X and Linux GDB variants), more than 70 WinDbg case studies, and 150 general trace and log analysis patterns. In addition, there are three supplemental volumes with articles reprinted in full color.
Tables of Contents and Indexes of WinDbg Commands from all volumes

Click on an individual volume to see its description and table of contents:


You can buy the 10-volume set from Software Diagnostics Services with a discount and also get free access to Software Diagnostics Library.
Praise for the series:
I have been working with reversing, dumps, IAT, unpacking, etc. and I am one of the few at my workplace that like analyzing hangs and crashes. I always knew that I had more to learn. So I continuously look for more info. Many links directed me to dumpanalysis.org. Frankly speaking, its spartan/simple design made me question its seriousness. But after reading some articles, I immediately decided to order "Memory Dump Analysis Anthology". I have only read 100 pages so far. But I am stunned. It is such an amazing book. How the author refines / reconstructs the call stack, and finds useful information in the stack is incredible. I am enormously thankful for the effort that the author has put in making these books. They are very didactic even though the topic is a bit hard. It is a real treasure.
Mattias Hogstrom
Software Codiagnostics
Software diagnostics is rarely a straightforward process of extracting the list of diagnostic indicators from software execution artifacts. Usually, it involves artifact transformation through trace and log analysis patterns.
Consider a very large software log. Simple inspection if its trace messages may point to some problem patterns:
However, different log transformations via trace analysis patterns may reveal additional problem patterns:
We call such transformations Software Codiagnostics or Data Codiagnostics in general for pattern-oriented data analysis. The prefix co- signifies cooperative processes and also the fact that such transformations are dual (by analogy with dual categories in mathematics) to diagnostic processes especially when such transformations are reversible (or partially reversible):

Existential Prognostics: Periodic Table of Diagnostic Patterns
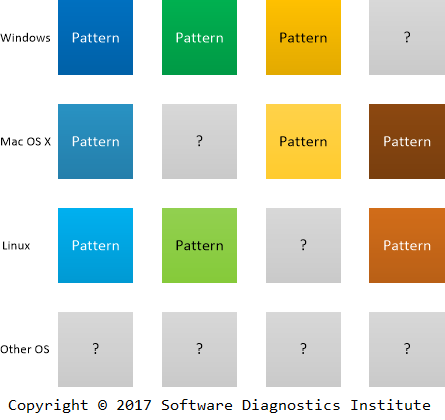
One of the features of the Periodic Table of Elements was the prediction of missing elements. In November 2010 we announced the discovery of the Periodic Table of Software Defects as “rules that make it possible to devise a memory dump and software trace analysis equivalent of the Periodic Table of Elements in Chemistry. It allows prediction of abnormal software behavior and structural defects and what patterns to look for after deploying software and collecting its artifacts”.
The publication of the second edition of Encyclopedia of Crash Dump Analysis Patterns makes it possible to see what patterns are expected in your favorite operating system and software product even if they have not been observed or cataloged yet (see its Table of Contents). This is why we call this type of prognostics existential as affirming or implying the existence of a diagnostic pattern, whether it is a problem pattern or problem analysis pattern.
As an example, we can tell the story of pattern prediction and discovery. An engineer expressed the doubt about the existence of Lateral Damage crash dump analysis pattern for Linux systems since he had never observed it during his diagnostic practice. Years passed, and it was recently observed and cataloged when analyzing Linux process core dumps.
Encyclopedia of Crash Dump Analysis Patterns
The following direct links can be used to order the book now:
New! The second edition is now available.
Buy Paperback or Kindle from Amazon
Buy Paperback from Barnes & Noble
Buy Paperback from Book Depository
Also available in PDF format from Software Diagnostics Services
The first edition is available for SkillSoft Books24x7 subscribers
![]()
This reference reprints with corrections, additional comments, and classification 373 alphabetically arranged and cross-referenced memory analysis patterns originally published in Memory Dump Analysis Anthology volumes 1 – 9 including 5 analysis patterns from volume 10a. This pattern catalog is a part of pattern-oriented software diagnostics, forensics, prognostics, root cause analysis, and debugging developed by Software Diagnostics Institute. Most of the analysis patterns are illustrated with examples for WinDbg from Debugging Tools for Windows with a few examples from Mac OS X and Linux for GDB. The second edition includes more than 50 new analysis patterns and more than 70 new examples and comments for analysis patterns published in the first edition.
Product information:
- Title: Encyclopedia of Crash Dump Analysis Patterns: Detecting Abnormal Software Structure and Behavior in Computer Memory, Second Edition
- Authors: Dmitry Vostokov, Software Diagnostics Institute
- Language: English
- Product Dimensions: 24.6 x 18.9
- Paperback: 1,200 pages
- Publisher: OpenTask (March 2017)
- ISBN-13: 978-1-908043-83-2

Categorical Foundations of Software Diagnostics
Since extracting information about behaviour from states is a coalgebra* (in our case, we have a behaviour functor from software execution artefacts such as memory snapshots and logs to diagnostic indicators that form concrete problem patterns) we decided to recast pattern-oriented software diagnostics in category theory language terms.
We introduce the following categories:
- Concrete Execution Artefacts: Category CArtefacts
Example: 3 memory dumps of Windows process with monotonically increasing size. 3 objects from CArtefacts category.
- Concrete Problem Patterns: Category CProblemPatterns
Example: 3 instances of monotonically increased Windows process heap allocations from specific modules.
- Concrete Analysis Pattern: Functor FAnalysisPattern
Example: Memory Leak (Process Heap, Windows) specifies the analysis process.
- Concrete Analysis Patterns: Category CAnalysisPatterns with natural transformations between functors.
Some functors may be similar, for example, Memory Leaks from different platforms. There exists a natural transformation between them. Such natural transformations are called General Analysis Patterns. They form a 2-category.
Some objects from CProblemPatterns may be similar. There exist “generalising” arrows between. The collection of such arrows forms a 2-category of General Problem Patterns.
This is a bottom-up approach. A top-down approach is possible when we start with general categories and select concrete subcategories inside. However, we think in the bottom-up approach general categories arise naturally and correspond to principles of pattern-based part of pattern-oriented diagnostics.
The following diagram illustrated concrete software diagnostics categories:

* Bart Jacobs, Introduction to Coalgebra: Towards Mathematics of States and Observation (ISBN: 978-1107177895)
Reducing Analysis Pattern Complexity via Elementary Analysis Patterns
There are hundreds of debugger commands, such as commands from WinDbg, GDB, LLDB, and other debuggers. A typical diagnostic analysis pattern, for example, a memory dump analysis pattern, may involve many commands (Debugged! Magazine, March 2009). In November 2008 we proposed abstract debugging commands for common diagnostic, forensic, and debugging tasks. After the introduction of pattern-oriented diagnostic thinking we propose another analysis pattern abstraction level of Elementary Analysis Patterns that groups either real or abstract debugging commands and allows chaining analysis activities to uniformly describe diagnostic analysis patterns:

- Typical candidates include the following draft elementary analysis patterns for the new analysis pattern catalog:
- Setting Symbolic Information
- Listing Processes
- Setting Processes
- Listing Threads
- Setting Threads
- Listing Modules
- Listing Memory Regions
- Dumping Memory
- Listing Object Names
- Counting Objects
- Dumping Object State
- Checking Instrumentation
- Listing Heaps
- Listing Heap Entries
- Listing Stack Traces
- Listing CPUs
- Dumping Thread State
- Searching Memory
- ...
Some Elementary Analysis Patterns may correspond to a single WinDbg command, and some may group several debugger commands. The exact names will be incrementally added and incrementally refined over the course of catalog building process.
Some Elementary Analysis Patterns may be reused across different analysis pattern catalogs, for example, Setting Symbolic Information is also applicable to trace and log analysis, for example, Windows ETW traces (see No Trace Metafile analysis pattern) and Fiber Bundle analysis pattern where symbols are needed for associated stack traces or Adjoint Space where symbols are needed for associated memory snapshots.
Such analysis patterns are different from Elementary Software Diagnostics Patterns since the latter are about observed behavioral signs, but the former are about the analysis process.
Let’s look at one example. We observe increasing memory Counter Values for one Windows server process and look at its memory snapshots. The process doesn’t use .NET so we use process heap Memory Leak analysis pattern which can be split into the following sequentially applied Elementary Analysis Patterns that group appropriate WinDbg commands:
- Setting Symbols (.symfix, .sympath+)
- Checking Instrumentation (!gflag)
- Listing Heaps (!heap -s)
- Listing Heap Entries (!heap -k -h)
In the case of missing user mode stack trace database or before asking for it, we can also use the following Elementary Analysis Patterns for symbolic hints such as Module Hint analysis pattern, ASCII, and UNICODE data:
- Dumping Memory (dc, dps, dpS, dpa, dpu) for heap entries
- Searching Memory (s-sa, s-su) for heap entries
All these provide a better description of analysis patterns. The same approach can be applied to trace and log analysis including network trace analysis, memory forensics, reversing and malware analysis.
Principles of Pattern-Oriented Software Data Analysis
2016 is closing, and for 2017 we look forward to applying software diagnostics and software post-construction problem-solving insights gained over the 10 years of Software Diagnostics Institute research to software data analysis in general. In addition to memory snapshots (Dump Artefacts) and logs (Trace Artefacts) and their analysis that we abbreviated as DA+TA, we extend our pattern-oriented approach to additional artifacts as security data, source code, configuration data, telemetry, revision repositories, and stores. We consider all additional software data types as examples of generalized software narratives and traces and abbreviate as simply DATA.
It is time to bring together the principles of pattern-oriented data analysis:
1. Patterns-based
Data patterns and data analysis patterns are classified into catalogs and named to form pattern languages. Every major kind of software data and activity associated with its data analysis can have its own pattern language and catalog. Pattern catalogs are dynamic structures. New patterns are added, old are revised. New catalogs are refined, added, or combined. Pattern names change if necessary to accommodate new data meta-analysis insights (Pattern-Based Software Diagnostics). Patterns can be reused across different data domains.
2. Patterns-driven
Data patterns that are diagnosed using data analysis patterns that are guided by meta-patterns trigger appropriate actionable decisions (Pattern-Driven Software Diagnostics).
3. Systemic-based
Data analysis is a multidisciplinary activity incorporating insights from natural and medical sciences, humanities and social sciences (Systemic Software Diagnostics).
4. Mechanisms-based
The pattern-oriented data analysis may lead to data root cause analysis when coupled with mechanisms.
5. Narrative-based
Software data is a form of a software narrative including data analysis itself (the higher-order narrative analysis).
6. Pattern square-based
There are special and general data patterns and special and general data analysis patterns (Pattern Square).
7. Patterns-assisted
Since software usage is a human activity, software data analysis should be human-assisted. Data analysis patterns facilitate data analysis verifiability, elimination of data analysis errors, and provide independence of data analysis reporting from idiosyncratic data analysis habits*. Software data and data analysis patterns and their languages assist humans in achieving and maintaining software data analysis quality.
* B. Russo, The need for data analysis patterns (in software engineering), Perspectives on Data Science for Software Engineering (ISBN: 978-0128042069)
Pattern-Oriented Diagnostic Analysis Process
Previously we introduced Pattern-Oriented Debugging Process where software diagnostics played the major role as a part of debugging. However, in the case of a separate software diagnostic process, we introduce Pattern-Oriented Diagnostic Analysis Process, that incorporates diagnostic analysis requirements elicitation from problem description analysis and diagnostic report construction. Both new additions require separate pattern catalogs. Problem description analysis pattern catalog is already being extended, and the new catalog for diagnostic report construction is under development and will be published soon. The central process part, diagnostic artifact analysis, already has two extensive analysis pattern catalogs for software log analysis and memory analysis. The process is illustrated in the following diagram:

Software Trace and Log Analysis: A Pattern Reference
New! The Second Edition is now available.
Available for Kindle
Buy Paperback from Amazon
Buy Paperback from Barnes & Noble
Buy Paperback from Book Depository
Also available in PDF format from Software Diagnostics Services
The first edition is available for SkillSoft Books24x7 subscribers
![]()
General trace and log analysis patterns allow application of uniform problem detection and solving approach across diverse software environments. This pattern language covers any execution artifact from a small debugging trace to a distributed log with billions of messages from hundreds of computers, thousands of software components, threads, and processes. Pattern-oriented trace and log analysis is applicable to troubleshooting and debugging Windows, Mac OS X, Linux, FreeBSD, Android, iOS, z/OS, and any other possible computer platform including networking and IoT. Its pattern catalog is a part of pattern-oriented software diagnostics, forensics, prognostics, root cause analysis, and debugging developed by Software Diagnostics Institute (DumpAnalysis.org + TraceAnalysis.org). This reference reprints with corrections 133 patterns originally published in Memory Dump Analysis Anthology volumes 3 - 9 and Software Diagnostics Library (former Crash Dump Analysis blog, DumpAnalysis.org/blog). Full-color diagrams accompany most pattern descriptions. The second edition includes 33 more patterns and improved pattern index.
Product information:
- Title: Software Trace and Log Analysis: A Pattern Reference
- Authors: Dmitry Vostokov, Software Diagnostics Institute
- Language: English
- Product Dimensions: 21.6 x 14.0
- Paperback: 224 pages
- Publisher: OpenTask; 2 edition (November 2016)
- ISBN-13: 978-1-908043-82-5

Software Diagnostic Space as a General Graph of Software Narratives
By connecting various memory spaces (user, kernel, physical, virtual, orbifold, manifold, fiber bundle, adjoint), trace and log spaces, and problem description narratives we introduce Software Diagnostics Space as a search space for finding problem patterns using general and concrete analysis patterns. Using mathematical metaphors we view it as a general graph of statements from Software Problem Narrative (graph vertices) and various software narratives such as logs, traces and memory spaces (edges). Software problem narratives may be different from software problem descriptions (which we get from software users and which have their own analysis patterns) because they are controlled narratives of actor interactions while working with software (top right corner of software narratology square). For completeness, every software narrative edge has vertices by default as start and stop vertices.
We consider Software Diagnostic Space as Trace Mask of Software Problem Narrative with Special and General Traces and Logs.
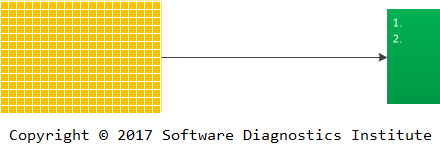
Let’s look at one example depicted in the following diagram:
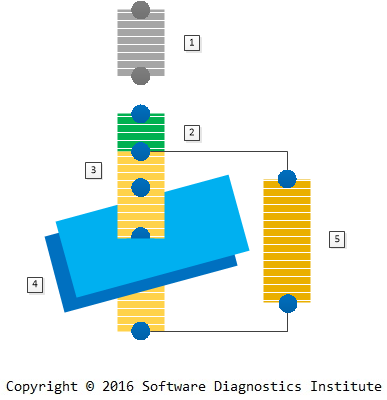
We have the problem description from a user who couldn’t exercise some software functionality unless some service was restarted. This is a problem description narrative (no. 1). A software support person constructed the problem reproduction setup narrative (no. 2) and recorded problem narrative no. 3 – 5 with tracing the client and server software and taking memory snapshots (Adjoint Space trace and log analysis pattern) of the corresponding service and another Coupled Process (memory analysis pattern).
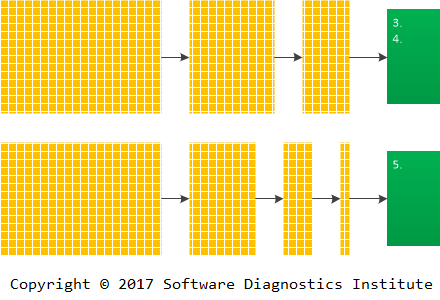
This can all be depicted in the following general graph (multigraph) diagram where loops show adjoint spaces (“instantaneous” artifact snapshots like memory, data):
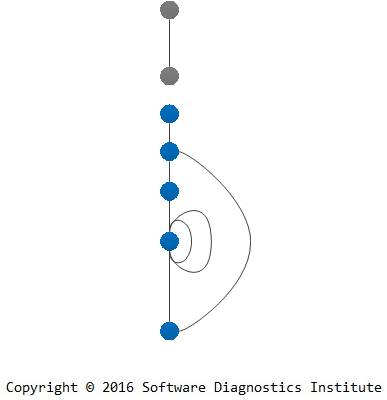
Such graphs may not be connected, and loops may be replaced by additional multiple edges with extra vertices.
The practical usage of such graphs can be demonstrated by their construction during problem analysis. Suppose that we have a problem description:
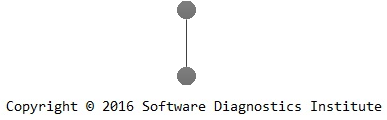
After its analysis we construct a problem narrative:
During its trace analysis we identify needed software trace edges:
We add multiple edges if tracing involves several software systems or different trace varieties:
Theoretical Software Diagnostics
The following direct links can be used to order the book now:
Buy Kindle version
Buy Paperback from Amazon
Buy Paperback from Barnes & Noble
Buy Paperback from Book Depository
Also available in PDF format from Software Diagnostics Services
Contains reprinted articles in full color from Memory Dump Analysis Anthology related to pattern-oriented software diagnostics with additional comments showing the historical development of this autonomous and distinctive discipline over the last 10 years.
Product information:
- Title: Theoretical Software Diagnostics: Collected Articles
- Authors: Dmitry Vostokov, Software Diagnostics Institute
- Language: English
- Product Dimensions: 21.6 x 14.0
- Paperback: 286 pages
- Publisher: OpenTask (October 2016)
- ISBN-13: 978-1-908043-98-6
Topological Software Trace and Log Analysis

Previously we based software trace and log analysis on software narratology. While continuing further research and development in that direction we are now constructing a new software trace and log analysis system called TopoLog based on ideas and techniques from topology (originally called analysis situs in Latin: analysis of the situation) as a part of theoretical software diagnostics. Over the years we described a few trace and log analysis patterns based on topological metaphors: Quotient Trace, Message Cover, Fiber Bundle, Sheaf of Activities, and Adjoint Space. Before starting our pattern work on software trace analysis we considered threads as braids in abstract space, and, after the first analysis patterns, we considered multithreading as multibraiding. For general software traces and logs including memory snapshots we propose topological state analysis, for example, analysis of the covering space via open and closed Memory Regions and Region Strata.
Memory Dump Analysis Anthology, Volume 9b
The following direct links can be used to order the book now:
Buy Paperback or Kindle from Amazon
Buy Paperback from Barnes & Noble
Buy Paperback from Book Depository
Also available in PDF format from Software Diagnostics Services
Contains revised, edited, cross-referenced, and thematically organized selected articles from Software Diagnostics Institute (DumpAnalysis.org + TraceAnalysis.org) and Software Diagnostics Library (former Crash Dump Analysis blog, DumpAnalysis.org/blog) about software diagnostics, root cause analysis, debugging, crash and hang dump analysis, software trace and log analysis written in March - September 2016 for software engineers developing and maintaining products on Windows platforms, quality assurance engineers testing software, technical support and escalation engineers dealing with complex software issues, security researchers, reverse engineers, malware and memory forensics analysts. This volume is fully cross-referenced with volumes 1 – 9a and features:
- 11 new crash dump analysis patterns
- 11 new software log and trace analysis patterns
- New structural memory pattern
- Introduction to Riemann root cause analysis language
- Introduction to problem solving as code
- Introduction to Dia|gram graphical diagnostic analysis language
- Introduction to iterative pattern-oriented root cause analysis
- Definition of theoretical software diagnostics
Product information:
- Title: Memory Dump Analysis Anthology, Volume 9b
- Authors: Dmitry Vostokov, Software Diagnostics Institute
- Language: English
- Product Dimensions: 22.86 x 15.24
- Paperback: 149 pages
- Publisher: OpenTask (October 2016)
- ISBN-13: 978-1-908043-36-8

Theoretical Software Diagnostics and Education
After writing so much about software diagnostics, we introduce its abstract generalising principles of pattern orientation and systems thinking as Theory of Software Diagnostics. We were thinking about the importance of theory for quite some time until we got acquainted with the work of Leo Klejn who coined a term “theoretical archaeology.” Then we also decided to coin the similar term for software meta-diagnostics since we compiled two books as guides to software diagnostics principles irrespective of software platforms, vendors, and their software products: Software Diagnostics and Principles of Memory Dump Analysis and plan to publish a compilation of related theoretical articles (Theoretical Software Diagnostics, ISBN-13: 978-1-908043-98-6, forthcoming September 2016). Looking for the development of theoretical archaeology as guidance makes sense because it emerged recently in contemporary times and also deals with artefacts, historical reconstruction, and time- and memory-related issues, albeit of a different nature. While working on theoretical foundations and principles for many years, we had to learn theories, ideas, and metaphors of other disciplines used in software diagnostics that we call software para-diagnostic theories by analogy with para-archaeological (coined by Klejn) theories such as history, sociology, linguistics. In his book Introduction to Theoretical Archaeology: Meta-archaeology, Klejn made a few remarks on the required theoretical education. We would like to reformulate them in relation to theoretical software diagnostics:
- Very few people do theory because theoretical thinking requires broad education and polymath knowledge across many disciplines. We found that:
- Computer science and software engineering education helps in the practical side of software diagnostics but is not enough;
- Knowledge of university-level mathematics and natural science education help in understanding of technical diagnostics but is not enough;
- Knowledge of the principles of medical diagnostics helps because pattern-oriented facet of theoretical software diagnostics is partially based on medical metaphors;
- Knowledge of semiotics helps in understanding of the role of signs in theoretical software diagnostics;
- Knowledge of philosophy helps in deeper understanding of foundational aspects of theoretical software diagnostics such as the nature of problems, their phenomenology, meaning, and understanding;
- Humanities education (analysis of human-made artefacts) is very important since software diagnostics is also based on artefact analysis.
- Such education is needed from earlier up and in addition to computers and coding should also include history, philology, narratology, and literary theory.
- In summary, broad reading is required to get acquainted with diagnostics expertise in various domains of human activity.
Iterative Pattern-Oriented Root Cause Analysis
When we introduced A.P.M. patterns-based root cause analysis methodology (Artefacts. Patterns. Mechanisms.), it may have made an impression of a waterfall-type process with some iterations between artefact collection and diagnostic analysis when collected artefacts are not good. However, software post-construction problem solving is usually iterative, with memory dumps and software logs collected again and again after the preliminary root cause analysis.
To illustrate the iterative nature of the process we first name its stages as Artefact Acquisition for Artefacts, Artefact Analysis for Patterns (diagnostics), and Analysis of Analysis for Mechanisms (root cause analysis):

Now we rearrange these AA stages:

After the preliminary root cause analysis (Analysis of Analysis) we may need to gather more artefacts for further diagnostics and more precise RCA, and this is reflected in more focused stages:
