





02/17/17
Congestion is growing: so how do we tackle it?
As the all-new INRIX Global Traffic Scorecard demonstrates, congestion is a truly global phenomenon. No country is immune and all of the world&...
Read OnThe INRIX Global Traffic Scorecard is the largest study of its kind.
We analyzed and ranked the impact of traffic congestion in:
5 continents | 38 countries | 1,064 cities
Population and economic growth alongside continued urbanization are the root causes of congestion. As cities strive to update or expand aging infrastructure, the application of big data and analytics to understand and help combat traffic congestion is crucial to the health and development of our cities. The INRIX 2016 Global Traffic Scorecard uses a new methodology to provide a data-rich evaluation of urban travel, traffic health and vibrancy for over 1,000 cities around the world.
Use the interactive tool below to see where your city ranks and how it performed.

The INRIX 2016 Traffic Scorecard analyzed congestion in 1,064 cities in 38 countries – the largest ever study of its kind.

Los Angeles commuters spent over 100 hours a year in traffic jams in 2016 – more than any other city in the world.

On average, Americans spent an hour a week stuck in traffic on their commutes in 2016.

In London, being stuck in congestion in 2016 cost drivers more than £1,911 each and more than £6 billion across the city as a whole.

Dublin was the slowest major city studied at 4.7mph (7.5kph) during all congested periods, with peak hour speeds at 3.4mph (5.5kph). Slower than horse and cart.

The slowest traffic across all congested periods in 2016 was in Oaxaca, Mexico at 3.6mph (5.9kph). Humans walk at about 3.1mph (5kph).
Congestion cost U.S. drivers nearly $300 Billion in 2016, an average of $1,400 per driver INRIX Global Traffic Scorecard analyzes and ranks...
Learn MoreINRIX Global Traffic Scorecard analyses and ranks the impact of traffic congestion in 1,064 cities across 38 countries worldwide – the...
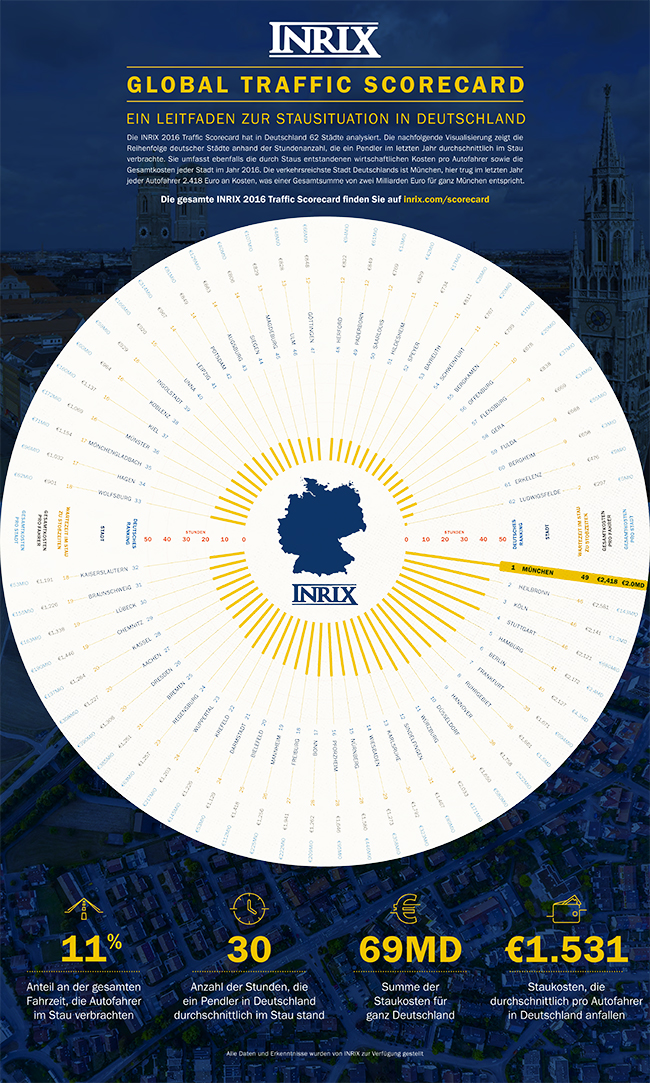
Learn MoreDie INRIX 2016 Traffic Scorecard analysiert den Einfluss von Verkehrsstaus in weltweit 1.064 Städten über 38 Länder hinweg und ist damit...
Learn More
As the all-new INRIX Global Traffic Scorecard demonstrates, congestion is a truly global phenomenon. No country is immune and all of the world&...
Read On
With excitement, the INRIX Research team has just released the all-new INRIX 2016 Traffic Scorecard. The comprehensive study provides something...
Read On2016 (2015) INRIX Traffic Scorecard Rank – The 2016 INRIX Traffic Scorecard ranks 205 major cities of the world by the Peak Hours Spent in Congestion. The 2015 rank is provided in parentheses.
2016 All Cities Rank – For the first time ever, INRIX ranked 1,064 cities in the world by Peak Hours Spent in Congestion. The 2015 rank is provided in parentheses.
Hours Spent in Congestion – This is the average number of hours a driver would spend in congestion during peak hours based upon 240 commuting days.
ICI (INRIX Congestion Index) – INRIX Congestion Index is a new, state of the art congestion metric for transportation professionals that analyzes congestion’s impact across the entire road network. See the report for full details.
% Driving Time Spent in Congestion – This is the percentage of driving time that is spent in congestion, which means that road speeds are less than 65% of free flow speeds.
Peak – The percentage of time spent in congestion during peak hours.
Daytime – An estimate of the percentage of time spent in congestion on weekdays at noon.
Overall -This is average percentage of driving time a driver spends in congestion.