Showing posts with label JavaScript. Show all posts

Thursday, January 12, 2017

Crafting a high-performance TV user interface using React


The Netflix TV interface is constantly evolving as we strive to figure out the best experience for our members. For example, after A/B testing, eye-tracking research, and customer feedback we recently rolled out video previews to help members make better decisions about what to watch. We’ve written before about how our TV application consists of an SDK installed natively on the device, a JavaScript application that can be updated at any time, and a rendering layer known as Gibbon. In this post we’ll highlight some of the strategies we’ve employed along the way to optimize our JavaScript application performance.

React-Gibbon

In 2015, we embarked on a wholesale rewrite and modernization of our TV UI architecture. We decided to use React because its one-way data flow and declarative approach to UI development make it easier to reason about our app. Obviously, we’d need our own flavor of React since at that time it only targeted the DOM. We were able to create a prototype that targeted Gibbon pretty quickly. This prototype eventually evolved into React-Gibbon and we began to work on building out our new React-based UI.

React-Gibbon’s API would be very familiar to anyone who has worked with React-DOM. The primary difference is that instead of divs, spans, inputs etc, we have a single “widget” drawing primitive that supports inline styling.

React.createClass({
   render() {
       return <Widget style={{ text: 'Hello World', textSize: 20 }} />;
   }
});

Performance is a key challenge

Our app runs on hundreds of different devices, from the latest game consoles like the PS4 Pro to budget consumer electronics devices with limited memory and processing power. The low-end machines we target can often have sub-GHz single core CPUs, low memory and limited graphics acceleration. To make things even more challenging, our JavaScript environment is an older non-JIT version of JavaScriptCore. These restrictions make super responsive 60fps experiences especially tricky and drive many of the differences between React-Gibbon and React-DOM.

Measure, measure, measure

When approaching performance optimization it’s important to first identify the metrics you will use to measure the success of your efforts. We use the following metrics to gauge overall application performance:

  • Key Input Responsiveness - the time taken to render a change in response to a key press
  • Time To Interactivity - the time to start up the app
  • Frames Per Second - the consistency and smoothness of our animations
  • Memory Usage


The strategies outlined below are primarily aimed at improving key input responsiveness. They were all identified, tested and measured on our devices and are not necessarily applicable in other environments. As with all “best practice” suggestions it is important to be skeptical and verify that they work in your environment, and for your use case. We started off by using profiling tools to identify what code paths were executing and what their share of the total render time was; this lead us to some interesting observations.

Observation: React.createElement has a cost

When Babel transpiles JSX it converts it into a number of React.createElement function calls which when evaluated produce a description of the next Component to render. If we can predict what the createElement function will produce, we can inline the call with the expected result at build time rather than at runtime.


// JSX
render() {
   return <MyComponent key='mykey' prop1='foo' prop2='bar' />;
}

// Transpiled
render() {
   return React.createElement(MyComponent, { key: 'mykey', prop1: 'foo', prop2: 'bar' });
}

// With inlining
render() {
   return {
       type: MyComponent,
       props: {
           prop1: 'foo',
           prop2: 'bar'
       },
       key: 'mykey'
   };
}


As you can see we have removed the cost of the createElement call completely, a triumph for the “can we just not?” school of software optimization.

We wondered whether it would be possible to apply this technique across our whole application and avoid calling createElement entirely. What we found was that if we used a ref on our elements, createElement needs to be called in order to hook up the owner at runtime. This also applies if you’re using the spread operator which may contain a ref value (we’ll come back to this later).

We use a custom Babel plugin for element inlining, but there is an official plugin that you can use right now. Rather than an object literal, the official plugin will emit a call to a helper function that is likely to disappear thanks to the magic of V8 function inlining. After applying our plugin there were still quite a few components that weren’t being inlined, specifically Higher-order Components which make up a decent share of the total components being rendered in our app.

Problem: Higher-order Components can’t use Inlining

We love Higher-order Components (HOCs) as an alternative to mixins. HOCs make it easy to layer on behavior while maintaining a separation of concerns. We wanted to take advantage of inlining in our HOCs, but we ran into an issue: HOCs usually act as a pass-through for their props. This naturally leads to the use of the spread operator, which prevents the Babel plug-in from being able to inline.

When we began the process of rewriting our app, we decided that all interactions with the rendering layer would go through declarative APIs. For example, instead of doing:

componentDidMount() {
   this.refs.someWidget.focus()
}

In order to move application focus to a particular Widget, we instead implemented a declarative focus API that allows us to describe what should be focused during render like so:

render() {
   return <Widget focused={true} />;
}

This had the fortunate side-effect of allowing us to avoid the use of refs throughout the application. As a result we were able to apply inlining regardless of whether the code used a spread or not.


// before inlining
render() {
   return <MyComponent {...this.props} />;
}

// after inlining
render() {
   return {
       type: MyComponent,
       props: this.props
   };
}
This greatly reduced the amount of function calls and property merging that we were previously having to do but it did not eliminate it completely.

Problem: Property interception still requires a merge

After we had managed to inline our components, our app was still spending a lot of time merging properties inside our HOCs. This was not surprising, as HOCs often intercept incoming props in order to add their own or change the value of a particular prop before forwarding on to the wrapped component.

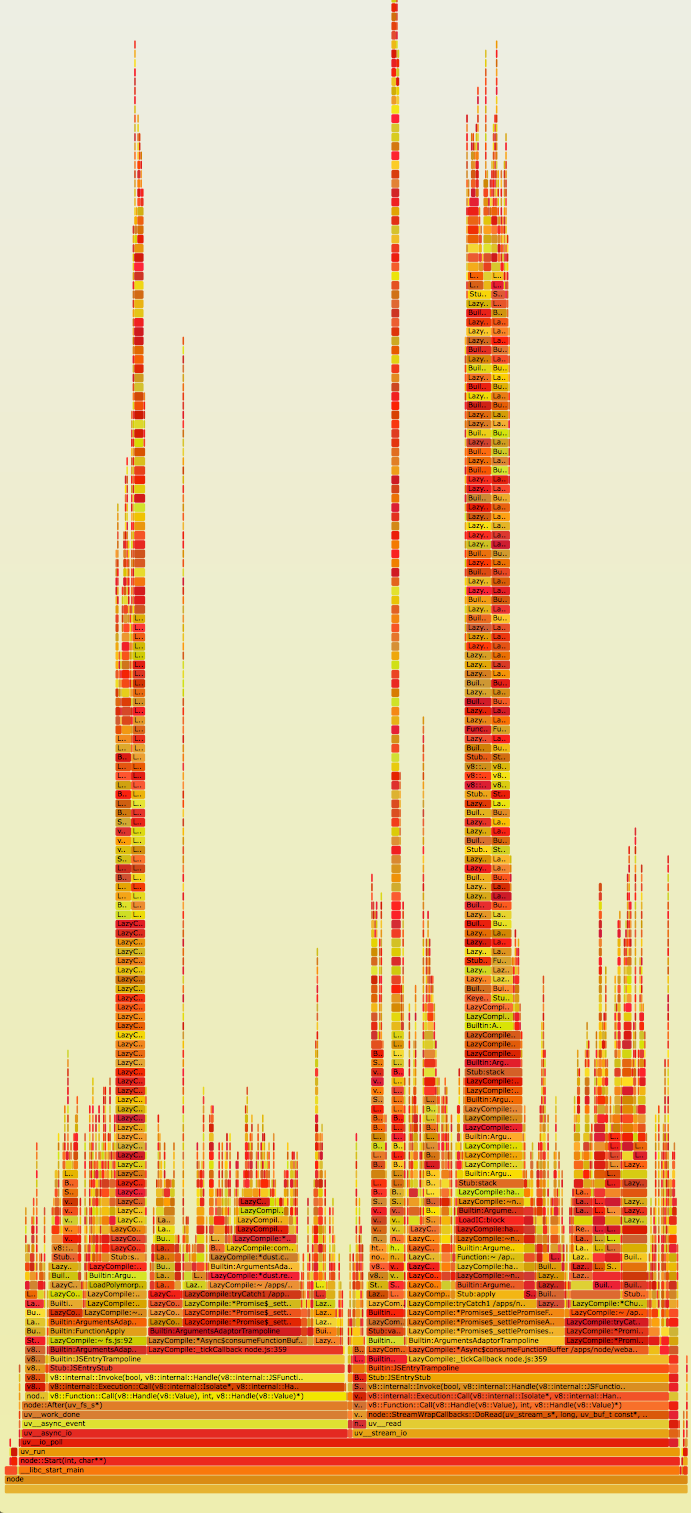
We did analysis of how stacks of HOCs scaled with prop count and component depth on one of our devices and the results were informative.


Screenshot 2017-01-11 12.31.30.png


They showed that there is a roughly linear relationship between the number of props moving through the stack and the render time for a given component depth.

Death by a thousand props

Based on our findings we realized that we could improve the performance of our app substantially by limiting the number of props passed through the stack. We found that groups of props were often related and always changed at the same time. In these cases, it made sense to group those related props under a single “namespace” prop. If a namespace prop can be modeled as an immutable value, subsequent calls to shouldComponentUpdate calls can be optimized further by checking referential equality rather than doing a deep comparison. This gave us some good wins but eventually we found that we had reduced the prop count as much as was feasible. It was now time to resort to more extreme measures.

Merging props without key iteration

Warning, here be dragons! This is not recommended and most likely will break many things in weird and unexpected ways.

After reducing the props moving through our app we were experimenting with other ways to reduce the time spent merging props between HOCs. We realized that we could use the prototype chain to achieve the same goals while avoiding key iteration.


// before proto merge
render() {
   const newProps = Object.assign({}, this.props, { prop1: 'foo' })
   return <MyComponent {...newProps} />;
}

// after proto merge
render() {
   const newProps = { prop1: 'foo' };
   newProps.__proto__ = this.props;
   return {
       type: MyComponent,
       props: newProps
   };
}

In the example above we reduced the 100 depth 100 prop case from a render time of ~500ms to ~60ms. Be advised that using this approach introduced some interesting bugs, namely in the event that this.props is a frozen object . When this happens the prototype chain approach only works if the __proto__ is assigned after the newProps object is created. Needless to say, if you are not the owner of newProps it would not be wise to assign the prototype at all.

Problem: “Diffing” styles was slow

Once React knows the elements it needs to render it must then diff them with the previous values in order to determine the minimal changes that must be applied to the actual DOM elements. Through profiling we found that this process was costly, especially during mount - partly due to the need to iterate over a large number of style properties.

Separate out style props based on what’s likely to change

We found that often many of the style values we were setting were never actually changed. For example, say we have a Widget used to display some dynamic text value. It has the properties text, textSize, textWeight and textColor. The text property will change during the lifetime of this Widget but we want the remaining properties to stay the same. The cost of diffing the 4 widget style props is spent on each and every render. We can reduce this by separating out the things that could change from the things that don't.

const memoizedStylesObject = { textSize: 20, textWeight: ‘bold’, textColor: ‘blue’ };


<Widget staticStyle={memoizedStylesObject} style={{ text: this.props.text }} />

If we are careful to memoize the memoizedStylesObject object, React-Gibbon can then check for referential equality and only diff its values if that check proves false. This has no effect on the time it takes to mount the widget but pays off on every subsequent render.

Why not avoid the iteration all together?

Taking this idea further, if we know what style props are being set on a particular widget, we can write a function that does the same work without having to iterate over any keys. We wrote a custom Babel plugin that performed static analysis on component render methods. It determines which styles are going to be applied and builds a custom diff-and-apply function which is then attached to the widget props.


// This function is written by the static analysis plugin
function __update__(widget, nextProps, prevProps) {
   var style = nextProps.style,
       prev_style = prevProps && prevProps.style;


   if (prev_style) {
       var text = style.text;
       if (text !== prev_style.text) {
           widget.text = text;
       }
   } else {
       widget.text = style.text;
   }
}


React.createClass({
   render() {
       return (
           <Widget __update__={__update__} style={{ text: this.props.title }}  />
       );
   }
});


Internally React-Gibbon looks for the presence of the “special” __update__ prop and will skip the usual iteration over previous and next style props, instead applying the properties directly to the widget if they have changed. This had a huge impact on our render times at the cost of increasing the size of the distributable.

Performance is a feature

Our environment is unique, but the techniques we used to identify opportunities for performance improvements are not. We measured, tested and verified all of our changes on real devices. Those investigations led us to discover a common theme: key iteration was expensive. As a result we set out to identify merging in our application, and determine whether they could be optimized. Here’s a list of some of the other things we’ve done in our quest to improve performance:

  • Custom Composite Component - hyper optimized for our platform
  • Pre-mounting screens to improve perceived transition time
  • Component pooling in Lists
  • Memoization of expensive computations

Building a Netflix TV UI experience that can run on the variety of devices we support is a fun challenge. We nurture a performance-oriented culture on the team and are constantly trying to improve the experiences for everyone, whether they use the Xbox One S, a smart TV or a streaming stick. Come join us if that sounds like your jam!


Wednesday, March 23, 2016

Performance without Compromise

Last week we hosted our latest Netflix JavaScript Talks event at our headquarters in Los Gatos, CA. We gave two talks about our unflinching stance on performance. In our first talk, Steve McGuire shared how we achieved a completely declarative, React-based architecture that’s fast on the devices in your living room. He talked about our architecture principles (no refs, no observation, no mixins or inheritance, immutable state, and top-down rendering) and the techniques we used to hit our tough performance targets. In our second talk, Ben Lesh explained what RxJS is, and why we use and love it. He shared the motivations behind a new version of RxJS and how we built it from the ground up with an eye on performance and debugging.

React.js for TV UIs


RxJS Version 5


Videos from our past talks can always be found on our Netflix UI Engineering channel on YouTube. If you’re interested in being notified of future events, just sign up on our notification list.

By Kim Trott

Thursday, December 3, 2015

Debugging Node.js in Production

By Kim Trott, Yunong Xiao

We recently hosted our latest JavaScript Talks event on our new campus at Netflix headquarters in Los Gatos, California. Yunong Xiao, senior software engineer on our Node.js platform, presented on debugging Node.js in production. Yunong showed hands-on techniques using the scientific method to root cause and solve for runtime performance issues, crashes, errors, and memory leaks.


We’ve shared some useful links from our talk:
Videos from our past talks can always be found on our Netflix UI Engineering channel on YouTube. If you’re interested in being notified of future events, just sign up on our notification list.

Monday, August 17, 2015

Netflix Releases Falcor Developer Preview

by Jafar Husain, Paul Taylor and Michael Paulson

Developers strive to create the illusion that all of their application’s data is sitting right there on the user’s device just waiting to be displayed. To make that experience a reality, data must be efficiently retrieved from the network and intelligently cached on the client.

That’s why Netflix created Falcor, a JavaScript library for efficient data fetching. Falcor powers Netflix’s mobile, desktop and TV applications.

Falcor lets you represent all your remote data sources as a single domain model via JSON Graph. Falcor makes it easy to access as much or as little of your model as you want, when you want it. You retrieve your data using familiar JavaScript operations like get, set, and call. If you know your data, you know your API.

You code the same way no matter where the data is, whether in memory on the client or over the network on the server. Falcor keeps your data in a single, coherent cache and manages stale data and cache pruning for you. Falcor automatically traverses references in your graph and makes requests as needed. It transparently handles all network communications, opportunistically batching and de-duping requests.

Today, Netflix is unveiling a developer preview of Falcor:

Falcor is still under active development and we’ll be unveiling a roadmap soon. This developer preview includes a Node version of our Falcor Router not yet in production use.

We’re excited to start developing in the open and share this library with the community, and eager for your feedback and contributions.

For ongoing updates, follow Falcor on Twitter!

Wednesday, August 5, 2015

Making Netflix.com Faster

by Kristofer Baxter

Simply put, performance matters. We know members want to immediately start browsing or watching their favorite content and have found that faster startup leads to more satisfying usage. So, when building the long-awaited update to netflix.com, the Website UI Engineering team made startup performance a first tier priority.

The impact of this effort netted a 70% reduction in startup time, and was focused in three key areas:

  1. Server and Client Rendering
  2. Universal JavaScript
  3. JavaScript Payload Reductions

Server and Client Rendering

The netflix.com legacy website stack had a hard separation between server markup and client enhancement. This was primarily due to the different programming languages used in each part of our application. On the server, there was Java with Tomcat, Struts and Tiles. On the browser client, we enhanced server-generated markup with JavaScript, primarily via jQuery.

This separation led to undesirable results in our startup time. Every time a visitor came to any page on netflix.com our Java tier would generate the majority of the response needed for the entire page's lifetime and deliver it as HTML markup. Often, users would be waiting for the generation of markup for large parts of the page they would never visit.

Our new architecture renders only a small amount of the page's markup, bootstrapping the client view. We can easily change the amount of the total view the server generates, making it easy to see the positive or negative impact. The server requires less data to deliver a response and spends less time converting data into DOM elements. Once the client JavaScript has taken over, it can retrieve all additional data for the remainder of the current and future views of a session on demand. The large wins here were the reduction of processing time in the server, and the consolidation of the rendering into one language.

We find the flexibility afforded by server and client rendering allows us to make intelligent choices of what to request and render in the server and the client, leading to a faster startup and a smoother transition between views.

Universal JavaScript

In order to support identical rendering on the client and server, we needed to rethink our rendering pipeline. Our previous architecture's separation between the generation of markup on the server and the enhancement of it on the client had to be dropped.

Three large pain points shaped our new Node.js architecture:

  1. Context switching between languages was not ideal.
  2. Enhancement of markup required too much direct coupling between server-only code generating markup and the client-only code enhancing it.
  3. We’d rather generate all our markup using the same API.

There are many solutions to this problem that don't require Universal JavaScript, but we found this lesson was most appropriate: When there are two copies of the same thing, it's fairly easy for one to be slightly different than the other. Using Universal JavaScript means the rendering logic is simply passed down to the client.

Node.js and React.js are natural fits for this style of application. With Node.js and React.js, we can render from the server and subsequently render changes entirely on the client after the initial markup and React.js components have been transmitted to the browser. This flexibility allows for the application to render the exact same output independent of the location of the rendering. The hard separation is no longer present and it's far less likely for the server and client to be different than one another.

Without shared rendering logic we couldn't have realized the potential of rendering only what was necessary on startup and everything else as data became available.

Reduce JavaScript Payload Impact

Building rich interactive experiences on the web often translates into a large JavaScript payload for users. In our new architecture, we placed significant emphasis on pruning large dependencies we can knowingly replace with smaller modules and delivering JavaScript only applicable for the current visitor.

Many of the large dependencies we relied on in the legacy architecture didn't apply in the new one. We've replaced these dependencies in favor of newer, more efficient libraries. Replacing these libraries resulted in a much smaller JavaScript payload, meaning members need less JavaScript to start browsing. We know there is significant work remaining here, and we're actively working to trim our JavaScript payload down further.

Time To Interactive

In order to test and understand the impact of our choices, we monitor a metric we call time to interactive (tti).

Amount of time spent between first known startup of the application platform and when the UI is interactive regardless of view. Note that this does not require that the UI is done loading, but is the first point at which the customer can interact with the UI using an input device.

For applications running inside a web browser, this data is easily retrievable from the Navigation Timing API (where supported).

Work is Ongoing

We firmly believe high performance is not an optional engineering goal – it's a requirement for creating great user-experiences. We have made significant strides in startup performance, and are committed to challenging our industry’s best-practices in the pursuit of a better experience for our members.

Over the coming months we'll be investigating Service Workers, ASM.js, Web Assembly, and other emerging web standards to see if we can leverage them for a more performant website experience. If you’re interested in helping create and shape the next generation of performant web user-experiences apply here.

Wednesday, January 28, 2015

Netflix Likes React


We are making big changes in the way we build the Netflix experience with Facebook’s React library. Today, we will share our thoughts on what makes React so compelling and how it is evolving our approach to UI development.

At the beginning of last year, Netflix UI engineers embarked on several ambitious projects to dramatically transform the user experience on our desktop and mobile platforms. Given a UI redesign of a scale similar to that undergone by TVs and game consoles, it was essential for us to re-evaluate our existing UI technology stack and to determine whether to explore new solutions. Do we have the right building blocks to create best-in-class single-page web applications? And what specific problems are we looking to solve?
Much of our existing front-end infrastructure consists of hand-rolled components optimized for the current website and iOS application. Our decision to adopt React was influenced by a number of factors, most notably: 1) startup speed, 2) runtime performance, and 3) modularity.

Startup Speed

We want to reduce the initial load time needed to provide Netflix members with a much more seamless, dynamic way to browse and watch individualized content. However, we find that the cost to deliver and render the UI past login can be significant, especially on our mobile platforms where there is a lot more variability in network conditions.

In addition to the time required to bootstrap our single-page application (i.e. download and process initial markup, scripts, stylesheets), we need to fetch data, including movie and show recommendations, to create a personalized experience. While network latency tends to be our biggest bottleneck, another major factor affecting startup performance is in the creation of DOM elements based on the parsed JSON payload containing the recommendations. Is there a way to minimize the network requests and processing time needed to render the home screen? We are looking for a hybrid solution that will allow us to deliver above-the-fold static markup on first load via server-side rendering, thereby reducing the tax incurred in the aforementioned startup operations, and at the same time enable dynamic elements in the UI through client-side scripting.

Runtime Performance

To build our most visually-rich cinematic Netflix experience to date for the website and iOS platforms, efficient UI rendering is critical. While there are fewer hardware constraints on desktops (compared to TVs and set-top boxes), expensive operations can still compromise UI responsiveness. In particular, DOM manipulations that result in reflows and repaints are especially detrimental to user experience.

Modularity

Our front-end infrastructure must support the numerous A/B tests we run in terms of the ability to rapidly build out new features and designs that code-wise must co-exist with the control experience (against which the new experiences are tested). For example, we can have an A/B test that compares 9 different design variations in the UI, which could mean maintaining code for 10 views for the duration of the test. Upon completion of the test, it should be easy for us to productize the experience that performed the best for our members and clean up code for the 9 other views that did not.

Advantages of React

React stood out in that its defining features not only satisfied the criteria set forth above, but offered other advantages including being relatively easy to grasp and ability to opt-out, for example, to handle custom user interactions and rendering code. We were able to leverage the following features to improve our application’s initial load times, runtime performance, and overall scalability: 1) isomorphic JavaScript, 2) virtual DOM rendering, and 3) support for compositional design patterns.

Isomorphic JavaScript

React enabled us to build JavaScript UI code that can be executed in both server (e.g. Node.js) and client contexts. To improve our start up times, we built a hybrid application where the initial markup is rendered server-side and the resulting UI elements are subsequently manipulated as done in a single-page application. It was possible to achieve this with React as it can render without a live DOM, e.g. via React.renderToString, or React.renderToStaticMarkup. Furthermore, the UI code written using the React library that is responsible for generating the markup could be shared with the client to handle cases where re-rendering was necessary.

Virtual DOM

To reduce the penalties incurred by live DOM manipulation, React applies updates to a virtual DOM in pure JavaScript and then determines the minimal set of DOM operations necessary via a diff algorithm. The diffing of virtual DOM trees is fast relative to actual DOM modifications, especially using today’s increasingly efficient JavaScript engines such as WebKit’s Nitro with JIT compilation. Furthermore, we can eliminate the need for traditional data binding, which has its own performance implications and scalability challenges.

React Components and Mixins

React provides powerful Component and Mixin APIs that we relied on heavily to create reusable views, share common functionality, and patterns to facilitate feature extension. When A/B testing different designs, we can implement the views as separate React subcomponents that get rendered by a parent component depending on the user’s allocation in the test. Similarly, differences in behavioral logic can be abstracted into React mixins. Although it is possible to achieve modularity with a classical inheritance pattern, frequent changes in superclass interfaces to support new features affects existing subclasses and increases code fragility. React’s compositional pattern is ideal for overall maintenance and scalability of our front-end codebase as it isolates much of the A/B test code.

React has exceeded our requirements and enabled us to build a tremendous foundation on which to innovate the Netflix experience. Stay tuned in the coming months, as we will dive more deeply into how we are using React to transform traditional UI development!

By Jordanna Kwok


Monday, December 8, 2014

Version 7: The Evolution of JavaScript

By Jafar Husain


We held our last Netflix JavaScript Talks event of 2014 on Dec. 2nd, where we discussed some of the interesting features already available for use in JavaScript 6, and where things are headed with JavaScript 7. As a member of the JavaScript TC39 ECMAScript committee, Netflix has been working with other committee members to explore powerful new features like Object.observe, async functions and async generators. Many of these features have already started appearing in modern browsers and it’s not too early to start playing with them.

The video from the event is now available to watch below or on our Netflix UI Engineering channel on YouTube along with other talks from past events.


It’s been a lot of fun hosting our Netflix JavaScript Talks series this past year and we have several exciting talks planned for 2015. If you’re interested in being notified of our future events, just sign up on our notification list. We’ll also be sharing some interesting work we’re doing with React at the React.js Conf at the end of January.


Wednesday, November 19, 2014

Node.js in Flames

We’ve been busy building our next-generation Netflix.com web application using Node.js. You can learn more about our approach from the presentation we delivered at NodeConf.eu a few months ago. Today, I want to share some recent learnings from performance tuning this new application stack.

We were first clued in to a possible issue when we noticed that request latencies to our Node.js application would increase progressively with time. The app was also burning CPU more than expected, and closely correlated to the higher latency. While using rolling reboots as a temporary workaround, we raced to find the root cause using new performance analysis tools and techniques in our Linux EC2 environment.

Flames Rising

We noticed that request latencies to our Node.js application would increase progressively with time. Specifically, some of our endpoints’ latencies would start at 1ms and increase by 10ms every hour. We also saw a correlated increase in CPU usage.

skitch.png

This graph plots request latency in ms for each region against time. Each color corresponds to a different AWS AZ. You can see latencies steadily increase by 10 ms an hour and peak at around 60 ms before the instances are rebooted.

Dousing the Fire

Initially we hypothesized that there might be something faulty, such as a memory leak in our own request handlers that was causing the rising latencies. We tested this assertion by load-testing the app in isolation, adding metrics that measured both the latency of only our request handlers and the total latency of a request, as well as increasing the Node.js heap size to 32Gb.

We saw that our request handler’s latencies stayed constant across the lifetime of the process at 1 ms. We also saw that the process’s heap size stayed fairly constant at around 1.2 Gb. However, overall request latencies and CPU usage continued to rise. This absolved our own handlers of blame, and pointed to problems deeper in the stack.

Something was taking an additional 60 ms to service the request. What we needed was a way to profile the application’s CPU usage and visualize where we’re spending most of our time on CPU. Enter CPU flame graphs and Linux Perf Events to the rescue.

For those unfamiliar with flame graphs, it’s best to read Brendan Gregg’s excellent article explaining what they are -- but here’s a quick summary (straight from the article).
  • Each box represents a function in the stack (a "stack frame").
  • The y-axis shows stack depth (number of frames on the stack). The top box shows the function that was on-CPU. Everything beneath that is ancestry. The function beneath a function is its parent, just like the stack traces shown earlier.
  • The x-axis spans the sample population. It does not show the passing of time from left to right, as most graphs do. The left to right ordering has no meaning (it's sorted alphabetically).
  • The width of the box shows the total time it was on-CPU or part of an ancestry that was on-CPU (based on sample count). Wider box functions may be slower than narrow box functions, or, they may simply be called more often. The call count is not shown (or known via sampling).
  • The sample count can exceed elapsed time if multiple threads were running and sampled concurrently.
  • The colors aren't significant, and are picked at random to be warm colors. It's called "flame graph" as it's showing what is hot on-CPU. And, it's interactive: mouse over the SVGs to reveal details.
Previously Node.js flame graphs had only been used on systems with DTrace, using Dave Pacheco’s Node.js jstack() support. However, the Google v8 team has more recently added perf_events support to v8, which allows similar stack profiling of JavaScript symbols on Linux. Brendan has written instructions for how to use this new support, which arrived in Node.js version 0.11.13, to create Node.js flame graphs on Linux.


Here’s the original SVG of the flame graph. Immediately, we see incredibly high stacks in the application (y-axis). We also see we’re spending quite a lot of time in those stacks (x-axis). On closer inspection, it seems the stack frames are full of references to Express.js’s router.handle and router.handle.next functions. The Express.js source code reveals a couple of interesting tidbits1.
  • Route handlers for all endpoints are stored in one global array.
  • Express.js recursively iterates through and invokes all handlers until it finds the right route handler.
A global array is not the ideal data structure for this use case. It’s unclear why Express.js chose not to use a constant time data structure like a map to store its handlers. Each request requires an expensive O(n) look up in the route array in order to find its route handler. Compounding matters, the array is traversed recursively. This explains why we saw such tall stacks in the flame graphs. Interestingly, Express.js even allows you to set many identical route handlers for a route. You can unwittingly set a request chain like so.
[a, b, c, c, c, c, d, e, f, g, h]
Requests for route c would terminate at the first occurrence of the c handler (position 2 in the array). However, requests for d would only terminate at position 6 in the array, having needless spent time spinning through a, b and multiple instances of c. We verified this by running the following vanilla express app.
var express = require('express');
var app = express();
app.get('/foo', function (req, res) {
   res.send('hi');
}); 
// add a second foo route handler
app.get('/foo', function (req, res) {
   res.send('hi2');
});
console.log('stack', app._router.stack);
app.listen(3000);
Running this Express.js app returns these route handlers.
stack [ { keys: [], regexp: /^\/?(?=/|$)/i, handle: [Function: query] },
 { keys: [],
   regexp: /^\/?(?=/|$)/i,
   handle: [Function: expressInit] },
 { keys: [],
   regexp: /^\/foo\/?$/i,
   handle: [Function],
   route: { path: '/foo', stack: [Object], methods: [Object] } },
 { keys: [],
   regexp: /^\/foo\/?$/i,
   handle: [Function],
   route: { path: '/foo', stack: [Object], methods: [Object] } } ]
Notice there are two identical route handlers for /foo. It would have been nice for Express.js to throw an error whenever there’s more than one route handler chain for a route.

At this point the leading hypothesis was that the handler array was increasing in size with time, thus leading to the increase of latencies as each handler is invoked. Most likely we were leaking handlers somewhere in our code, possibly due to the duplicate handler issue. We added additional logging which periodically dumps out the route handler array, and noticed the array was growing by 10 elements every hour. These handlers happened to be identical to each other, mirroring the example from above.
[...
{ handle: [Function: serveStatic],
   name: 'serveStatic',
   params: undefined,
   path: undefined,
   keys: [],
   regexp: { /^\/?(?=\/|$)/i fast_slash: true },
   route: undefined },
 { handle: [Function: serveStatic],
   name: 'serveStatic',
   params: undefined,
   path: undefined,
   keys: [],
   regexp: { /^\/?(?=\/|$)/i fast_slash: true },
   route: undefined },
 { handle: [Function: serveStatic],
   name: 'serveStatic',
   params: undefined,
   path: undefined,
   keys: [],
   regexp: { /^\/?(?=\/|$)/i fast_slash: true },
   route: undefined },
...
]
Something was adding the same Express.js provided static route handler 10 times an hour. Further benchmarking revealed merely iterating through each of these handler instances cost about 1 ms of CPU time. This correlates to the latency problems we’ve seen, where our response latencies increase by 10 ms every hour.

This turned out be caused by a periodic (10/hour) function in our code. The main purpose of this was to refresh our route handlers from an external source. This was implemented by deleting old handlers and adding new ones to the array. Unfortunately, it was also inadvertently adding a static route handler with the same path each time it ran. Since Express.js allows for multiple route handlers given identical paths, these duplicate handlers were all added to the array. Making matter worse, they were added before the rest of the API handlers, which meant they all had to be invoked before we can service any requests to our service.

This fully explains why our request latencies were increasing by 10ms every hour. Indeed, when we fixed our code so that it stopped adding duplicate route handlers, our latency and CPU usage increases went away.

graph.png
Here we see our latencies drop down to 1 ms and remain there after we deployed our fix.

When the Smoke Cleared

What did we learn from this harrowing experience? First, we need to fully understand our dependencies before putting them into production. We made incorrect assumptions about the Express.js API without digging further into its code base. As a result, our misuse of the Express.js API was the ultimate root cause of our performance issue.

Second, given a performance problem, observability is of the utmost importance. Flame graphs gave us tremendous insight into where our app was spending most of its time on CPU. I can’t imagine how we would have solved this problem without being able to sample Node.js stacks and visualize them with flame graphs.

In our bid to improve observability even further, we are migrating to Restify, which will give us much better insights, visibility, and control of our applications2. This is beyond the scope of this article, so look out for future articles on how we’re leveraging Node.js at Netflix.

Interested in helping us solve problems like this? The Website UI team is hiring engineers to work on our Node.js stack.

Author: Yunong Xiao @yunongx

Footnotes
1 Specifically, this snippet of code. Notice next() is invoked recursively to iterate through the global route handler array named stack.
2 Restify provides many mechanisms to get visibility into your application, from DTrace support, to integration with the node-bunyan logging framework.