Announcing Our New .NET Error Monitoring SDK
Rollbar is happy to announce our official .NET error monitoring SDK. This new .NET SDK is more rreliable, supports all of the popular .NET platforms (NET Standard, .NET Framework, .NET Core, ASP.NET MVC, UWP, Mono, Xamarin), easy to configure, multithreading friendly, and more.
Rollbar helps you monitor errors in production applications. It provides you with a live error feed from your applications, including complete stack traces and contextual data to debug errors quickly. It also lets you easily understand your user experience by tracking who is affected by each error. Check out our features page to learn more about how it can help you.

.NET error monitoring, as seen in Rollbar
New Integration - Auto-create Clubhouse stories with error data from Rollbar
At Rollbar, we use Clubhouse to manage our software projects. One of the many ways we use it is for tracking issues in product releases. We'd have an epic in Clubhouse for each release, and create stories for bugs associated with the release that we need to fix. This is especially useful when we're working on service packs.
Introducing the Account Dashboard 📉
We are excited to release our new Account Dashboard! The Account Dashboard gives your engineering team insight into errors across multiple Rollbar projects. This insight provides an overview of how each application and service is performing, so you can quickly identify and drill down into problem areas and error trends.
Debugging JavaScript with Source Maps
One of the frustrating situations I often encounter when debugging JavaScript, is tracking down JavaScript errors to line 23 col 63475. I felt as though I was right on the edge of seeing the offending code and being able to fix it. And then, reality came crashing down. I realized that I’ve managed to debug myself right into the middle of a minified JavaScript file 😞.
There is a better way - Source Maps. JavaScript source maps are the key to taking what you’ve narrowed down in the minified code, and then being able to map them back to the source code so that you can view and resolve the problem without having to figure it out in the minified code.
Meet the Rollbar Team - Jaee Apte (Product Designer)
We're excited to introduce Jaee Apte, one of the newer members of our team. Jaee (pronounced "Zaa-ee") started at Rollbar as a Product Designer in October, and we are very happy to have her. She is also a talented visual artist, and enjoys product design because "it's a good bridge between being completely analytical and a crazy artist."
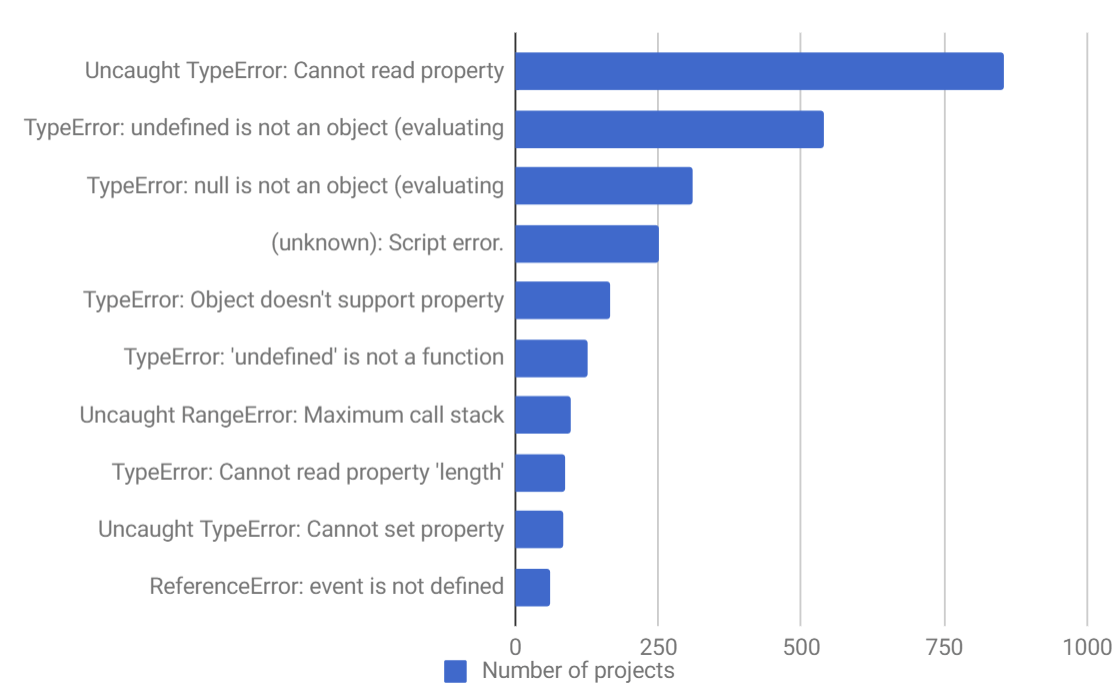
Top 10 JavaScript errors from 1000+ projects (and how to avoid them)
To give back to our community of developers, we looked at our database of thousands of projects and found the top 10 errors in JavaScript. We’re going to show you what causes them and how to prevent them from happening. If you avoid these "gotchas," it'll make you a better developer.
Because data is king, we collected, analyzed, and ranked the top 10 JavaScript errors. Rollbar collects all the errors for each project and summarizes how many times each one occurred. We do this by grouping errors according to their fingerprints. Basically, we group two errors if the second one is just a repeat of the first. This gives users a nice overview instead of an overwhelming big dump like you’d see in a log file.
We focused on the errors most likely to affect you and your users. To do this, we ranked errors by the number of projects experiencing them across different companies. If we looked only at the total number of times each error occurred, then high-volume customers could overwhelm the data set with errors that are not relevant to most readers.
Here are the top 10 JavaScript errors:
Continuous Delivery with Jenkins and Rollbar
Continuous delivery (CD) helps reduce the cost, time and risk of delivering changes by allowing for fast incremental updates to applications in production. However, it’s essential to monitor your application after each deployment. You need to be notified immediately if something is wrong or users are having a poor experience.
Rollbar is a leading solution for error monitoring in production. It alerts you when new errors occur after a deployment. It can also tell you which deployment the error was first seen in, and which code changes were likely responsible. This can dramatically speed up your troubleshooting time and help you fix problems faster.

Monitoring tools for serverless environments and AWS Lambda
Serverless computing platforms like AWS Lambda represent a new computing paradigm. Over the past decade, we’ve been trying to abstract the application layer from the infrastructure layer. VMs started this by virtualizing hardware servers, and Docker containers extended this by packaging just the application code separate from the host system.
The next step in this process is to completely remove the host from the equation, and simply focus on the application code—which is what serverless computing is all about. But as with most things new, serverless forces you to change how you used to do things, including the way you monitor functions.
Below, I explain how monitoring changes in a serverless environment. I focus on Lambda in particular, although most of these observations apply to any type of modern serverless platform.


