
ಟ್ವೀಟ್ಗಳು
- ಟ್ವೀಟ್ಗಳು, ಪ್ರಸ್ತುತ ಪುಟ.
- ಟ್ವೀಟ್ಗಳು & ಪ್ರತಿಕ್ರಿಯೆಗಳು
- ಮಾಧ್ಯಮ
ನೀವು @canonicalizedco ಅವರನ್ನು ತಡೆಹಿಡಿದಿರುವಿರಿ
ಈ ಟ್ವೀಟ್ಗಳನ್ನು ವೀಕ್ಷಿಸಲು ನೀವು ಖಚಿತವಾಗಿ ಬಯಸುವಿರಾ? ಟ್ವೀಟ್ ವೀಕ್ಷಣೆಯು @canonicalizedco ಅವರ ತಡೆತೆರವುಗೊಳಿಸುವುದಿಲ್ಲ
-
Updated the "Improved Stacked Bars" article to include the legend-as-filter technique https://canonicalized.com/stacked-bar-charts-tableau-set-actions/?t#legend-filter …pic.twitter.com/vY2tUv51HC
ಧನ್ಯವಾದಗಳು. Twitter ಇದನ್ನು ನಿಮ್ಮ ಕಾಲರೇಖೆಯನ್ನು ಉತ್ತಮಗೊಳಿಸಲು ಬಳಸುತ್ತದೆ. ರದ್ದುಗೊಳಿಸುರದ್ದುಗೊಳಿಸು -
Dorian Banutoiu ಅವರು ಮರುಟ್ವೀಟಿಸಿದ್ದಾರೆ
me and
@emily1852 are talking@tableau set actions and more with@datavizlinds today, got any questions you want answered? Send them our way for@thetwpodcast#tableauಧನ್ಯವಾದಗಳು. Twitter ಇದನ್ನು ನಿಮ್ಮ ಕಾಲರೇಖೆಯನ್ನು ಉತ್ತಮಗೊಳಿಸಲು ಬಳಸುತ್ತದೆ. ರದ್ದುಗೊಳಿಸುರದ್ದುಗೊಳಿಸು -
#MakeoverMonday week 49. The New York Times "Shortz Era" between 1994 and 2017: comparing men and women constructors. Saturdays are bad! Used a cycle-plot to show the gap between men and women https://public.tableau.com/profile/dorian.barosan#!/vizhome/TheNewYorkTimesShortzErabetween1994and2017/Dashboard …pic.twitter.com/NEXxDy9SyG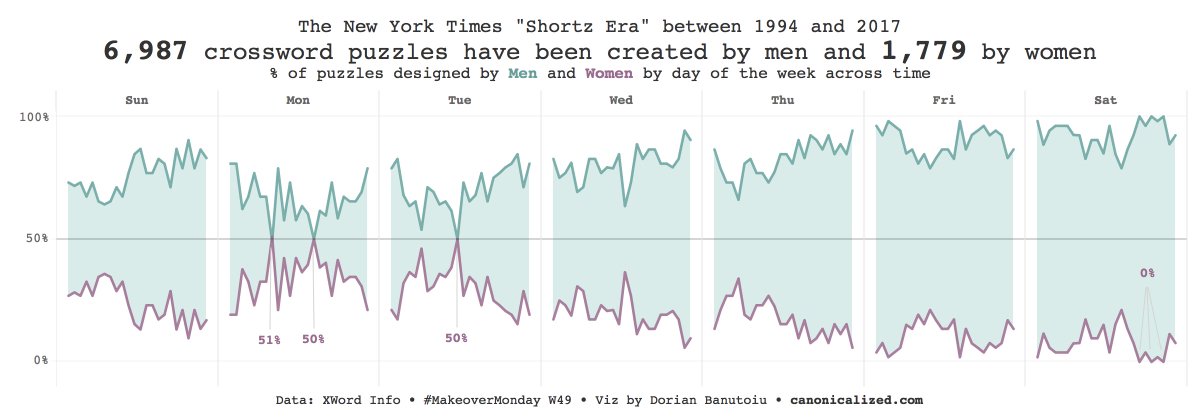 ಧನ್ಯವಾದಗಳು. Twitter ಇದನ್ನು ನಿಮ್ಮ ಕಾಲರೇಖೆಯನ್ನು ಉತ್ತಮಗೊಳಿಸಲು ಬಳಸುತ್ತದೆ. ರದ್ದುಗೊಳಿಸುರದ್ದುಗೊಳಿಸು
 -
A bit late implementing the feedback this week. Hopefully, it's not bad enough to make the blacklist! Thank you for the pointers
@TriMyData! https://public.tableau.com/profile/dorian.barosan#!/vizhome/Thecostofapartynightoutindifferentcitiesaroundtheworld/Dashboard1 …pic.twitter.com/G3U8TlGtd2ಈ ಥ್ರೆಡ್ ತೋರಿಸಿಧನ್ಯವಾದಗಳು. Twitter ಇದನ್ನು ನಿಮ್ಮ ಕಾಲರೇಖೆಯನ್ನು ಉತ್ತಮಗೊಳಿಸಲು ಬಳಸುತ್ತದೆ. ರದ್ದುಗೊಳಿಸುರದ್ದುಗೊಳಿಸು -
It doesn’t look like she’ll be slowing down anytime soon!
 https://twitter.com/datavizlinds/status/1068167772402786304 …
 ಧನ್ಯವಾದಗಳು. Twitter ಇದನ್ನು ನಿಮ್ಮ ಕಾಲರೇಖೆಯನ್ನು ಉತ್ತಮಗೊಳಿಸಲು ಬಳಸುತ್ತದೆ. ರದ್ದುಗೊಳಿಸುರದ್ದುಗೊಳಿಸು
 -
Blog post alert

 Interactive Highlight Tables/Heatmaps with
 #Tableau#SetActions &#TransparentSheets exemplified on a Cohort Analysis https://canonicalized.com/tableau-heatmaps-set-actions/ … Includes some inspiration I got from@datavizlinds and@sirvizalotpic.twitter.com/ftGWTzloUoಧನ್ಯವಾದಗಳು. Twitter ಇದನ್ನು ನಿಮ್ಮ ಕಾಲರೇಖೆಯನ್ನು ಉತ್ತಮಗೊಳಿಸಲು ಬಳಸುತ್ತದೆ. ರದ್ದುಗೊಳಿಸುರದ್ದುಗೊಳಿಸು -
Harsh lesson for
@ZeeVizGirl in the previous week of#MakeoverMonday http://www.makeovermonday.co.uk/week-47-2018/ She iterated on the feedback, learned the lesson and this week she tried again. This time her effort was rewarded with#VOTD#feedbackworks@TriMyData@VizWizBIhttps://twitter.com/tableaupublic/status/1067508456360484865 …ಧನ್ಯವಾದಗಳು. Twitter ಇದನ್ನು ನಿಮ್ಮ ಕಾಲರೇಖೆಯನ್ನು ಉತ್ತಮಗೊಳಿಸಲು ಬಳಸುತ್ತದೆ. ರದ್ದುಗೊಳಿಸುರದ್ದುಗೊಳಿಸು -
Make sure to check out Lindsey's blog post on how to do it: http://www.lindseypoulter.com/2018/11/26/create-interactive-filterable-titles-in-tableau/ …
ಈ ಥ್ರೆಡ್ ತೋರಿಸಿಧನ್ಯವಾದಗಳು. Twitter ಇದನ್ನು ನಿಮ್ಮ ಕಾಲರೇಖೆಯನ್ನು ಉತ್ತಮಗೊಳಿಸಲು ಬಳಸುತ್ತದೆ. ರದ್ದುಗೊಳಿಸುರದ್ದುಗೊಳಿಸು -
#MakeoverMonday w48: The cost of a party night out in different cities. Used#SetActions to create a multi-filterable title Inspired by the@f_l_o_u_r_i_s_h journey to eradicate boring labels and beaten to the punch by@datavizlinds@TriMyData@VizWizBI https://public.tableau.com/profile/dorian.barosan#!/vizhome/Thecostofapartynightoutindifferentcitiesaroundtheworld/Dashboard1 …pic.twitter.com/TIpnZIjq9dಈ ಥ್ರೆಡ್ ತೋರಿಸಿಧನ್ಯವಾದಗಳು. Twitter ಇದನ್ನು ನಿಮ್ಮ ಕಾಲರೇಖೆಯನ್ನು ಉತ್ತಮಗೊಳಿಸಲು ಬಳಸುತ್ತದೆ. ರದ್ದುಗೊಳಿಸುರದ್ದುಗೊಳಿಸು -
Dorian Banutoiu ಅವರು ಮರುಟ್ವೀಟಿಸಿದ್ದಾರೆಧನ್ಯವಾದಗಳು. Twitter ಇದನ್ನು ನಿಮ್ಮ ಕಾಲರೇಖೆಯನ್ನು ಉತ್ತಮಗೊಳಿಸಲು ಬಳಸುತ್ತದೆ. ರದ್ದುಗೊಳಿಸುರದ್ದುಗೊಳಿಸು
-
Hey
#Tableau community, does anyone know if there is an option or an extension for translating text elements from a dashboard using an API like Google Translate or Microsoft?@tfoldi@infolabUK@ryanvizzes@ugamarkj@Biztory@tableau@acotgreaveಧನ್ಯವಾದಗಳು. Twitter ಇದನ್ನು ನಿಮ್ಮ ಕಾಲರೇಖೆಯನ್ನು ಉತ್ತಮಗೊಳಿಸಲು ಬಳಸುತ್ತದೆ. ರದ್ದುಗೊಳಿಸುರದ್ದುಗೊಳಿಸು -
Dorian Banutoiu ಅವರು ಮರುಟ್ವೀಟಿಸಿದ್ದಾರೆ
Zvinca plot is a space efficient variation of Cleveland dot plot, an exploratory design that ideally wraps the values into equal count sized bins, for independent investigation of different quantiles. It can encode thousands of values in a limited space for several distributions.https://twitter.com/canonicalizedco/status/1064665495557873664 …
 0:07
0:07#MakeoverMonday Week 47: Used a "Zvinca" plot innovated by Stephen Few and Daniel Zvinca. Added#SetActions for the interactive part of it.
2nd week in a row getting inspired by @danz_68's work https://public.tableau.com/profile/dorian.barosan#!/vizhome/mortgage_0/Zvinca …@tableau@tableaupublic@TriMyData@VizWizBI pic.twitter.com/hRghjdoYwzಧನ್ಯವಾದಗಳು. Twitter ಇದನ್ನು ನಿಮ್ಮ ಕಾಲರೇಖೆಯನ್ನು ಉತ್ತಮಗೊಳಿಸಲು ಬಳಸುತ್ತದೆ. ರದ್ದುಗೊಳಿಸುರದ್ದುಗೊಳಿಸು -
#MakeoverMonday Week 47: Used a "Zvinca" plot innovated by Stephen Few and Daniel Zvinca. Added#SetActions for the interactive part of it.
2nd week in a row getting inspired by @danz_68's work https://public.tableau.com/profile/dorian.barosan#!/vizhome/mortgage_0/Zvinca …@tableau@tableaupublic@TriMyData@VizWizBIpic.twitter.com/hRghjdoYwzಧನ್ಯವಾದಗಳು. Twitter ಇದನ್ನು ನಿಮ್ಮ ಕಾಲರೇಖೆಯನ್ನು ಉತ್ತಮಗೊಳಿಸಲು ಬಳಸುತ್ತದೆ. ರದ್ದುಗೊಳಿಸುರದ್ದುಗೊಳಿಸು -
Connecting Cycle Plots with
#Tableau#SetActions I'm curios to hear what the set action enthusiasts make of this The article that goes along with it: https://canonicalized.com/cycle-plots-tableau/ …
@tableau@tableaupublicpic.twitter.com/a4YcpOQN9bಧನ್ಯವಾದಗಳು. Twitter ಇದನ್ನು ನಿಮ್ಮ ಕಾಲರೇಖೆಯನ್ನು ಉತ್ತಮಗೊಳಿಸಲು ಬಳಸುತ್ತದೆ. ರದ್ದುಗೊಳಿಸುರದ್ದುಗೊಳಿಸು -
Dorian Banutoiu ಅವರು ಮರುಟ್ವೀಟಿಸಿದ್ದಾರೆ
Outstanding work for
#MakeoverMonday this week! My favorite part? Picking favorites .
And here they are... as well as two lessons, as always
.
And here they are... as well as two lessons, as always  .
Great to see such strong participation by long-term members and new participants and lots of
.
Great to see such strong participation by long-term members and new participants and lots of #womenindata http://www.makeovermonday.co.uk/week-46-2018/ pic.twitter.com/thzxX9piaU ಧನ್ಯವಾದಗಳು. Twitter ಇದನ್ನು ನಿಮ್ಮ ಕಾಲರೇಖೆಯನ್ನು ಉತ್ತಮಗೊಳಿಸಲು ಬಳಸುತ್ತದೆ. ರದ್ದುಗೊಳಿಸುರದ್ದುಗೊಳಿಸು
 -
Dorian Banutoiu ಅವರು ಮರುಟ್ವೀಟಿಸಿದ್ದಾರೆ
I am not aware of Tukey bagplots being a standard feature in any dataviz tool. Check out how how it looks and how helpful can be. It has the same meaning as a boxplot in 2D. But is not a combinations of 2 boxplots!https://twitter.com/canonicalizedco/status/1062731335834521600 …
 ಧನ್ಯವಾದಗಳು. Twitter ಇದನ್ನು ನಿಮ್ಮ ಕಾಲರೇಖೆಯನ್ನು ಉತ್ತಮಗೊಳಿಸಲು ಬಳಸುತ್ತದೆ. ರದ್ದುಗೊಳಿಸುರದ್ದುಗೊಳಿಸು
 -
"The path to diversity" for
#MakeoverMonday week 46. Finally got the chance to practice a Tukey bagplot for which I got the inspiration from Daniel Zvinca@danz_68 Thanks for the feedback@TriMyData@VizWizBI!@tableaupublic@tableau https://public.tableau.com/profile/dorian.barosan#!/vizhome/Pathtodiversity/Dashboard1 …pic.twitter.com/rRv5Cn5BZDಧನ್ಯವಾದಗಳು. Twitter ಇದನ್ನು ನಿಮ್ಮ ಕಾಲರೇಖೆಯನ್ನು ಉತ್ತಮಗೊಳಿಸಲು ಬಳಸುತ್ತದೆ. ರದ್ದುಗೊಳಿಸುರದ್ದುಗೊಳಿಸು -
Forgot to add a link to Tableau Public: https://public.tableau.com/profile/dorian.barosan#!/vizhome/AgingUSpopulation/Dashboard … <- interact
ಈ ಥ್ರೆಡ್ ತೋರಿಸಿಧನ್ಯವಾದಗಳು. Twitter ಇದನ್ನು ನಿಮ್ಮ ಕಾಲರೇಖೆಯನ್ನು ಉತ್ತಮಗೊಳಿಸಲು ಬಳಸುತ್ತದೆ. ರದ್ದುಗೊಳಿಸುರದ್ದುಗೊಳಿಸು -
#MakeoverMonday W45: A peek into the future of the US population#setactions round 2: highlighting with dots@tableaupublic@tableau@TriMyData@VizWizBIpic.twitter.com/C7zruLITHOಈ ಥ್ರೆಡ್ ತೋರಿಸಿಧನ್ಯವಾದಗಳು. Twitter ಇದನ್ನು ನಿಮ್ಮ ಕಾಲರೇಖೆಯನ್ನು ಉತ್ತಮಗೊಳಿಸಲು ಬಳಸುತ್ತದೆ. ರದ್ದುಗೊಳಿಸುರದ್ದುಗೊಳಿಸು -
#SetActions alert Improved Stacked Bar Charts with Tableau Set Actions: https://canonicalized.com/stacked-bar-charts-tableau-set-actions/ …
Got a lot of inspiration for this article mainly from @RodyZakovich, but also from@Marc_DS5@acotgreave@HighVizAbility@ChrisLuv@SimonBeaumont04@tableau@tableaupublicpic.twitter.com/CeBob6w5Fsಧನ್ಯವಾದಗಳು. Twitter ಇದನ್ನು ನಿಮ್ಮ ಕಾಲರೇಖೆಯನ್ನು ಉತ್ತಮಗೊಳಿಸಲು ಬಳಸುತ್ತದೆ. ರದ್ದುಗೊಳಿಸುರದ್ದುಗೊಳಿಸು


")

 Sarah Bartlett
ಲೋಡಿಂಗ್ ಸಮಯ ಸ್ವಲ್ಪ ತೆಗೆದುಕೊಳ್ಳುತ್ತಿರುವಂತೆನಿಸುತ್ತದೆ.
Twitter ಸಾಮರ್ಥ್ಯ ಮೀರಿರಬಹುದು ಅಥವಾ ಕ್ಷಣಿಕವಾದ ತೊಂದರೆಯನ್ನು ಅನುಭವಿಸುತ್ತಿರಬಹುದು. ಮತ್ತೆ ಪ್ರಯತ್ನಿಸಿ ಅಥವಾ ಹೆಚ್ಚಿನ ಮಾಹಿತಿಗೆ Twitter ಸ್ಥಿತಿಗೆ ಭೇಟಿ ನೀಡಿ.