

ಟ್ವೀಟ್ಗಳು
- ಟ್ವೀಟ್ಗಳು, ಪ್ರಸ್ತುತ ಪುಟ.
- ಟ್ವೀಟ್ಗಳು & ಪ್ರತಿಕ್ರಿಯೆಗಳು
- ಮಾಧ್ಯಮ
ನೀವು @boknowsdata ಅವರನ್ನು ತಡೆಹಿಡಿದಿರುವಿರಿ
ಈ ಟ್ವೀಟ್ಗಳನ್ನು ವೀಕ್ಷಿಸಲು ನೀವು ಖಚಿತವಾಗಿ ಬಯಸುವಿರಾ? ಟ್ವೀಟ್ ವೀಕ್ಷಣೆಯು @boknowsdata ಅವರ ತಡೆತೆರವುಗೊಳಿಸುವುದಿಲ್ಲ
-
Thanks to
@bcburden and@donmoyn for tweets that made me think about this, and@datakmart for the sweet mapping functionality that made joining results to shapefiles so easy.ಈ ಥ್ರೆಡ್ ತೋರಿಸಿಧನ್ಯವಾದಗಳು. Twitter ಇದನ್ನು ನಿಮ್ಮ ಕಾಲರೇಖೆಯನ್ನು ಉತ್ತಮಗೊಳಿಸಲು ಬಳಸುತ್ತದೆ. ರದ್ದುಗೊಳಿಸುರದ್ದುಗೊಳಿಸು -
Lots of
#dataviz shared around Wisconsin#gerrymandering lately. I wanted to dig deeper, focusing on uncontested seats to show how gerrymandering plays out. So, I made this representation.#tableau#wipolitics https://public.tableau.com/views/AnatomyofaGerrymandertheWisconsinAssembly/WIGerrymander?:embed=y&:display_count=yes&publish=yes … via@tableaupublicಈ ಥ್ರೆಡ್ ತೋರಿಸಿಧನ್ಯವಾದಗಳು. Twitter ಇದನ್ನು ನಿಮ್ಮ ಕಾಲರೇಖೆಯನ್ನು ಉತ್ತಮಗೊಳಿಸಲು ಬಳಸುತ್ತದೆ. ರದ್ದುಗೊಳಿಸುರದ್ದುಗೊಳಿಸು -
My first
#workoutwednesday. Had a couple false starts, but got there eventually!@AnnUJackson@LukeStanke@lorna_eden@curtisharris_@RodyZakovich@VizWizBI#workoutwednesday2018 https://public.tableau.com/views/McCreadyWorkoutWednesday12-5-18/WorkoutWednesday?:embed=y&:display_count=yes&publish=yes … via@tableaupublicಧನ್ಯವಾದಗಳು. Twitter ಇದನ್ನು ನಿಮ್ಮ ಕಾಲರೇಖೆಯನ್ನು ಉತ್ತಮಗೊಳಿಸಲು ಬಳಸುತ್ತದೆ. ರದ್ದುಗೊಳಿಸುರದ್ದುಗೊಳಿಸು -
Wisconsin released Nov. election data by county, so I built this viz of the Baldwin-Vukmir and Evers-Walker races. Interesting where Baldwin (D) + Walker (R) both won, + how Baldwin>Evers in every county.
#tableau#dataviz#wipolitics@tableaupublichttps://public.tableau.com/views/WisconsinNovember2018SenateandGovernorResults/WISummary?:embed=y&:display_count=yes&publish=yes …ಧನ್ಯವಾದಗಳು. Twitter ಇದನ್ನು ನಿಮ್ಮ ಕಾಲರೇಖೆಯನ್ನು ಉತ್ತಮಗೊಳಿಸಲು ಬಳಸುತ್ತದೆ. ರದ್ದುಗೊಳಿಸುರದ್ದುಗೊಳಿಸು -
The closest I've come to the
@fisalpine World Cup was when Lindsey Vonn's grandpa came to my grandpa's funeral. Here's my#sportsvizsunday!#tableau#dataviz#analytics#skifree@ProfDrKSchulte@SimonBeaumont04@JSBaucke@sportschordhttps://public.tableau.com/views/FISSkiWorldCupData/FISWorldCupSummary?:embed=y&:display_count=yes&publish=yes …ಧನ್ಯವಾದಗಳು. Twitter ಇದನ್ನು ನಿಮ್ಮ ಕಾಲರೇಖೆಯನ್ನು ಉತ್ತಮಗೊಳಿಸಲು ಬಳಸುತ್ತದೆ. ರದ್ದುಗೊಳಿಸುರದ್ದುಗೊಳಿಸು -
I used
@fangraphs data with Tableau's density marks to map home runs and stolen bases across the history of baseball. Love exploring the outliers - Ned Williamson, Babe Ruth, Maury Wills, etc.#tableau#dataviz#sportsvizsunday#mlb https://public.tableau.com/views/MLBHomeRunsandStealsHistory/HomeRuns?:embed=y&:display_count=yes&publish=yes … via@tableaupublicಧನ್ಯವಾದಗಳು. Twitter ಇದನ್ನು ನಿಮ್ಮ ಕಾಲರೇಖೆಯನ್ನು ಉತ್ತಮಗೊಳಿಸಲು ಬಳಸುತ್ತದೆ. ರದ್ದುಗೊಳಿಸುರದ್ದುಗೊಳಿಸು -
ಧನ್ಯವಾದಗಳು. Twitter ಇದನ್ನು ನಿಮ್ಮ ಕಾಲರೇಖೆಯನ್ನು ಉತ್ತಮಗೊಳಿಸಲು ಬಳಸುತ್ತದೆ. ರದ್ದುಗೊಳಿಸುರದ್ದುಗೊಳಿಸು
-
My
#makeovermonday was going to have an animated disco ball until I remembered pages don't work on Public. I still had fun.#tableau#dataviz@tableau@TriMyData@VizWizBI https://public.tableau.com/views/Costofanightout-McCreadyMakeoverMonday11-26-18/NightOut?:embed=y&:display_count=yes&publish=yes … via@tableaupublicಧನ್ಯವಾದಗಳು. Twitter ಇದನ್ನು ನಿಮ್ಮ ಕಾಲರೇಖೆಯನ್ನು ಉತ್ತಮಗೊಳಿಸಲು ಬಳಸುತ್ತದೆ. ರದ್ದುಗೊಳಿಸುರದ್ದುಗೊಳಿಸು -
College football rivalry viz #2 of the day...
#Wisconsin and#Minnesota for Paul Bunyan's Axe. h/a@lukestanke for the idea.#tableau#dataviz#badgers#gophers https://public.tableau.com/views/PaulBunyansAxeHistory-Wisconsinvs_Minnesotasince1890/TheGameHistory?:embed=y&:display_count=yes … via@tableaupublicಧನ್ಯವಾದಗಳು. Twitter ಇದನ್ನು ನಿಮ್ಮ ಕಾಲರೇಖೆಯನ್ನು ಉತ್ತಮಗೊಳಿಸಲು ಬಳಸುತ್ತದೆ. ರದ್ದುಗೊಳಿಸುರದ್ದುಗೊಳಿಸು -
In honor of
#thegame, here's a visual history of the#Michigan-#OSU football rivalry since 1897. Transparent sheets are such a game changer.#tableau#dataviz#sportsvizsunday@mgoblog@AceAnbender@Misopogon@thepowerrank https://public.tableau.com/views/TheGameHistory-Michigan-OSUsince1897/TheGameHistory?:embed=y&:display_count=yes&publish=yes … via@tableaupublicಧನ್ಯವಾದಗಳು. Twitter ಇದನ್ನು ನಿಮ್ಮ ಕಾಲರೇಖೆಯನ್ನು ಉತ್ತಮಗೊಳಿಸಲು ಬಳಸುತ್ತದೆ. ರದ್ದುಗೊಳಿಸುರದ್ದುಗೊಳಿಸು -
This
#makeovermonday on housing affordability screamed "quadrants" to me. Clocks as shapes add a little fun.#tableau#dataviz@infolabUK@VizWizBI@TriMyData https://public.tableau.com/views/HousingAffordability-McCreadyMakeoverMonday11_19_18/Summary?:embed=y&:display_count=yes&publish=yes … via@tableaupublicಧನ್ಯವಾದಗಳು. Twitter ಇದನ್ನು ನಿಮ್ಮ ಕಾಲರೇಖೆಯನ್ನು ಉತ್ತಮಗೊಳಿಸಲು ಬಳಸುತ್ತದೆ. ರದ್ದುಗೊಳಿಸುರದ್ದುಗೊಳಿಸು -
Today,
@WisconsinDPI released report cards for every district and school in the state. This viz uses public data and public shapefiles to help users explore the scores.#tableau#dataviz#education@mmsdschools@Tony4WI https://public.tableau.com/views/WisconsinDPIReportCards/WisconsinDPIReportCardScores?:embed=y&:display_count=yes&publish=yes … … via@tableaupublicಧನ್ಯವಾದಗಳು. Twitter ಇದನ್ನು ನಿಮ್ಮ ಕಾಲರೇಖೆಯನ್ನು ಉತ್ತಮಗೊಳಿಸಲು ಬಳಸುತ್ತದೆ. ರದ್ದುಗೊಳಿಸುರದ್ದುಗೊಳಿಸು -
My second
#makeovermonday: visualizing population projections. I wanted to try a colored background and make the age distribution look like a flag. It worked!#tableau#dataviz#usa@VizWizBI@TriMyData https://public.tableau.com/views/CensusPopulationProjections-MakeoverMonday11_5_18/FlagSummary?:embed=y&:display_count=yes&publish=yes … via@tableaupublicಧನ್ಯವಾದಗಳು. Twitter ಇದನ್ನು ನಿಮ್ಮ ಕಾಲರೇಖೆಯನ್ನು ಉತ್ತಮಗೊಳಿಸಲು ಬಳಸುತ್ತದೆ. ರದ್ದುಗೊಳಿಸುರದ್ದುಗೊಳಿಸು -
My first
#sportsvizsunday: a look at#MLS attendance since 1996. Logos as highlighters, team colors, plus viz in tooltip.#tableau#dataviz@SimonBeaumont04@JSBaucke@StatHunting https://public.tableau.com/views/MLSAttendanceHistoryNov2018/AttendanceSummary?:embed=y&:display_count=yes&publish=yes … via@tableaupublicಧನ್ಯವಾದಗಳು. Twitter ಇದನ್ನು ನಿಮ್ಮ ಕಾಲರೇಖೆಯನ್ನು ಉತ್ತಮಗೊಳಿಸಲು ಬಳಸುತ್ತದೆ. ರದ್ದುಗೊಳಿಸುರದ್ದುಗೊಳಿಸು -
Inspired by
@giorgialupi at#TC18, I created a visualization of@16personalities types across a department. Custom shapes give new life to a spreadsheet full of percentages. h/t@flerlagekev#tableau#dataviz https://public.tableau.com/views/16PersonalitiesSummary/16PersonalitiesSummary?:embed=y&:display_count=yes&publish=yes … via@tableaupublicಧನ್ಯವಾದಗಳು. Twitter ಇದನ್ನು ನಿಮ್ಮ ಕಾಲರೇಖೆಯನ್ನು ಉತ್ತಮಗೊಳಿಸಲು ಬಳಸುತ್ತದೆ. ರದ್ದುಗೊಳಿಸುರದ್ದುಗೊಳಿಸು -
ಧನ್ಯವಾದಗಳು. Twitter ಇದನ್ನು ನಿಮ್ಮ ಕಾಲರೇಖೆಯನ್ನು ಉತ್ತಮಗೊಳಿಸಲು ಬಳಸುತ್ತದೆ. ರದ್ದುಗೊಳಿಸುರದ್ದುಗೊಳಿಸು
-
Had a great time in the
#TC18 tip battle yesterday. Not embarrassing myself against@AnnUJackson is a new career highlight, and congrats to@lukestanke on the win! Being part of such a talented group was a blast.@chanjagg@MarkBradbourne@tableauing@SimonBeaumont04@FlerlageKevhttps://twitter.com/jordanscott__/status/1055218186726113281 …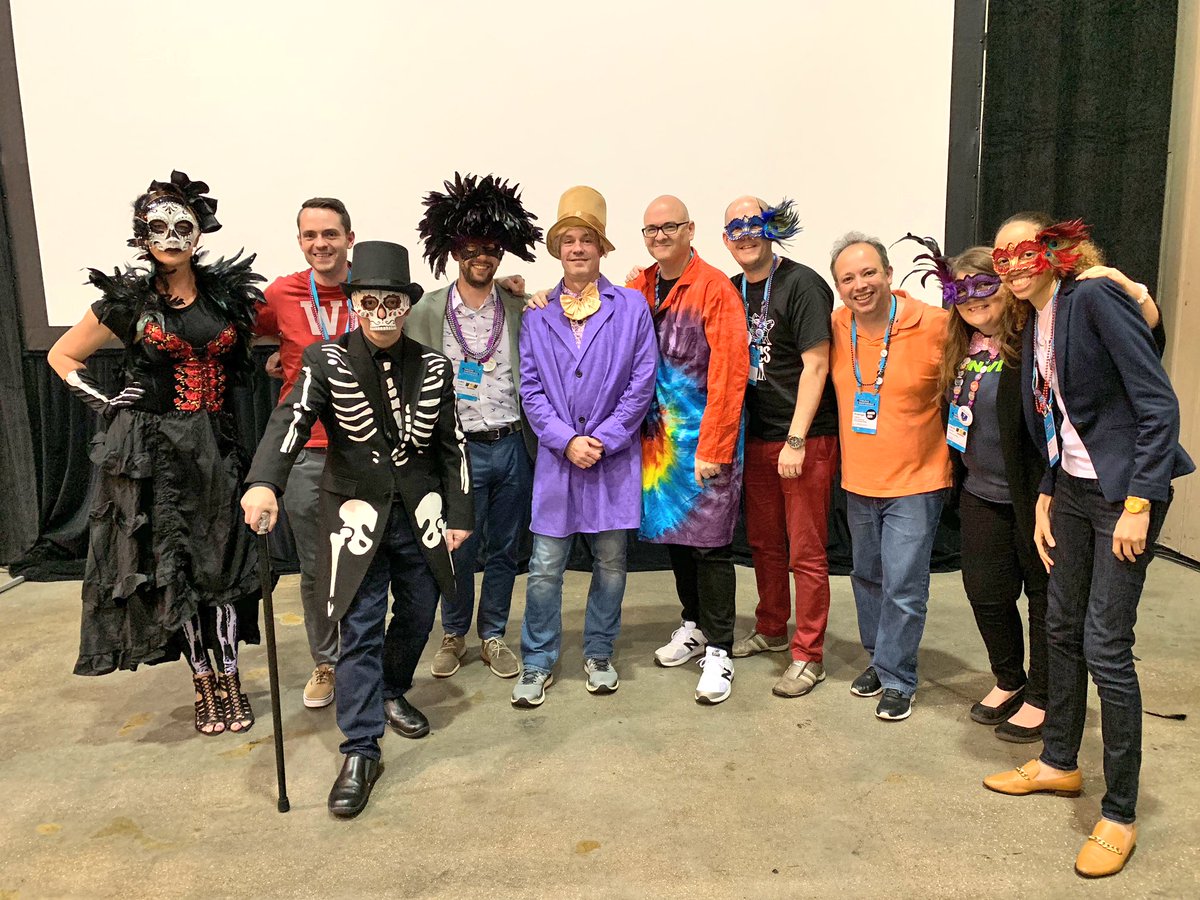 You guys...
#TC18 pic.twitter.com/KQfJp22Iynಧನ್ಯವಾದಗಳು. Twitter ಇದನ್ನು ನಿಮ್ಮ ಕಾಲರೇಖೆಯನ್ನು ಉತ್ತಮಗೊಳಿಸಲು ಬಳಸುತ್ತದೆ. ರದ್ದುಗೊಳಿಸುರದ್ದುಗೊಳಿಸು
 -
One of these things is not like the other ones. On a plane to represent
#MadisonTUG and@MMSDschools at the#TC18 Tableau User Group tip battle. 3:30 Wednesday.pic.twitter.com/9gKfA1eQ7r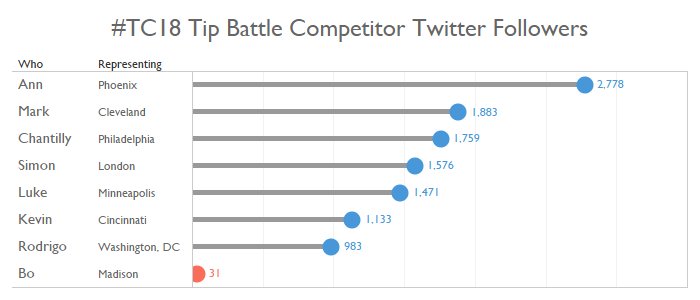 ಧನ್ಯವಾದಗಳು. Twitter ಇದನ್ನು ನಿಮ್ಮ ಕಾಲರೇಖೆಯನ್ನು ಉತ್ತಮಗೊಳಿಸಲು ಬಳಸುತ್ತದೆ. ರದ್ದುಗೊಳಿಸುರದ್ದುಗೊಳಿಸು
 -
At MMSD, we're using
#Tableau to help us think about our buildings. This dashboard merges facility condition data from@PRAtweets with our design principles to support our Building Excellence work.#dataviz#educationdata https://public.tableau.com/views/BuildingExcellenceSchoolConditionDashboard/Dashboard?:embed=y&:display_count=yes … via@tableaupublicಧನ್ಯವಾದಗಳು. Twitter ಇದನ್ನು ನಿಮ್ಮ ಕಾಲರೇಖೆಯನ್ನು ಉತ್ತಮಗೊಳಿಸಲು ಬಳಸುತ್ತದೆ. ರದ್ದುಗೊಳಿಸುರದ್ದುಗೊಳಿಸು -
Election data is intuitive, insight-rich, and pretty public. I made this viz while sitting at
#TC16 to look at what was going on back home. Wisconsin Presidential Election Result Changes by County https://public.tableau.com/views/WisconsinPresidentialElectionResultChangesbyCounty/WisconsinCountyShifts?:embed=y&:display_count=yes&:ignore_sticky_session=yes&:jsonOnly=true … via@tableaupublicಧನ್ಯವಾದಗಳು. Twitter ಇದನ್ನು ನಿಮ್ಮ ಕಾಲರೇಖೆಯನ್ನು ಉತ್ತಮಗೊಳಿಸಲು ಬಳಸುತ್ತದೆ. ರದ್ದುಗೊಳಿಸುರದ್ದುಗೊಳಿಸು


 Ann Jackson
ಲೋಡಿಂಗ್ ಸಮಯ ಸ್ವಲ್ಪ ತೆಗೆದುಕೊಳ್ಳುತ್ತಿರುವಂತೆನಿಸುತ್ತದೆ.
Twitter ಸಾಮರ್ಥ್ಯ ಮೀರಿರಬಹುದು ಅಥವಾ ಕ್ಷಣಿಕವಾದ ತೊಂದರೆಯನ್ನು ಅನುಭವಿಸುತ್ತಿರಬಹುದು. ಮತ್ತೆ ಪ್ರಯತ್ನಿಸಿ ಅಥವಾ ಹೆಚ್ಚಿನ ಮಾಹಿತಿಗೆ Twitter ಸ್ಥಿತಿಗೆ ಭೇಟಿ ನೀಡಿ.