The new Android Profiler window in Android Studio 3.0 replaces the Android Monitor tools. These new profiling tools provide realtime data for your app's CPU, memory, and network activity. You can perform sample-based method tracing to time your code execution, capture heap dumps, view memory allocations, and inspect the details of network-transmitted files. Check out the following video for an introduction to the Android Profiler.
To open the Android Profiler window, follow these steps:
- Click View > Tool Windows > Android Profiler (you can also click
Android Profiler
 in the toolbar).
 - At the top of the Android Profiler window, as shown in figure 1,
select the device 1 and the app process
2 you want to profile. If you've
connected a device over USB but don't see it listed, ensure that you have
enabled USB debugging.
If you're using the Android Emulator or a rooted device, the Android Profiler lists all running processes, even though they might not be debuggable. When you launch a debuggable app, that process is selected by default.
Android Profiler now displays a shared timeline view (figure 1), which includes a timeline with realtime graphs for CPU, memory, and network usage. The window also includes timeline zoom controls 3, a button to jump forward to the realtime updates 4, and an event timeline that shows activity states, user input events, and screen rotation events 5.
Once you start Android Profiler, it continues to collect profiling data
until you either disconnect the device or click Close
 .
.
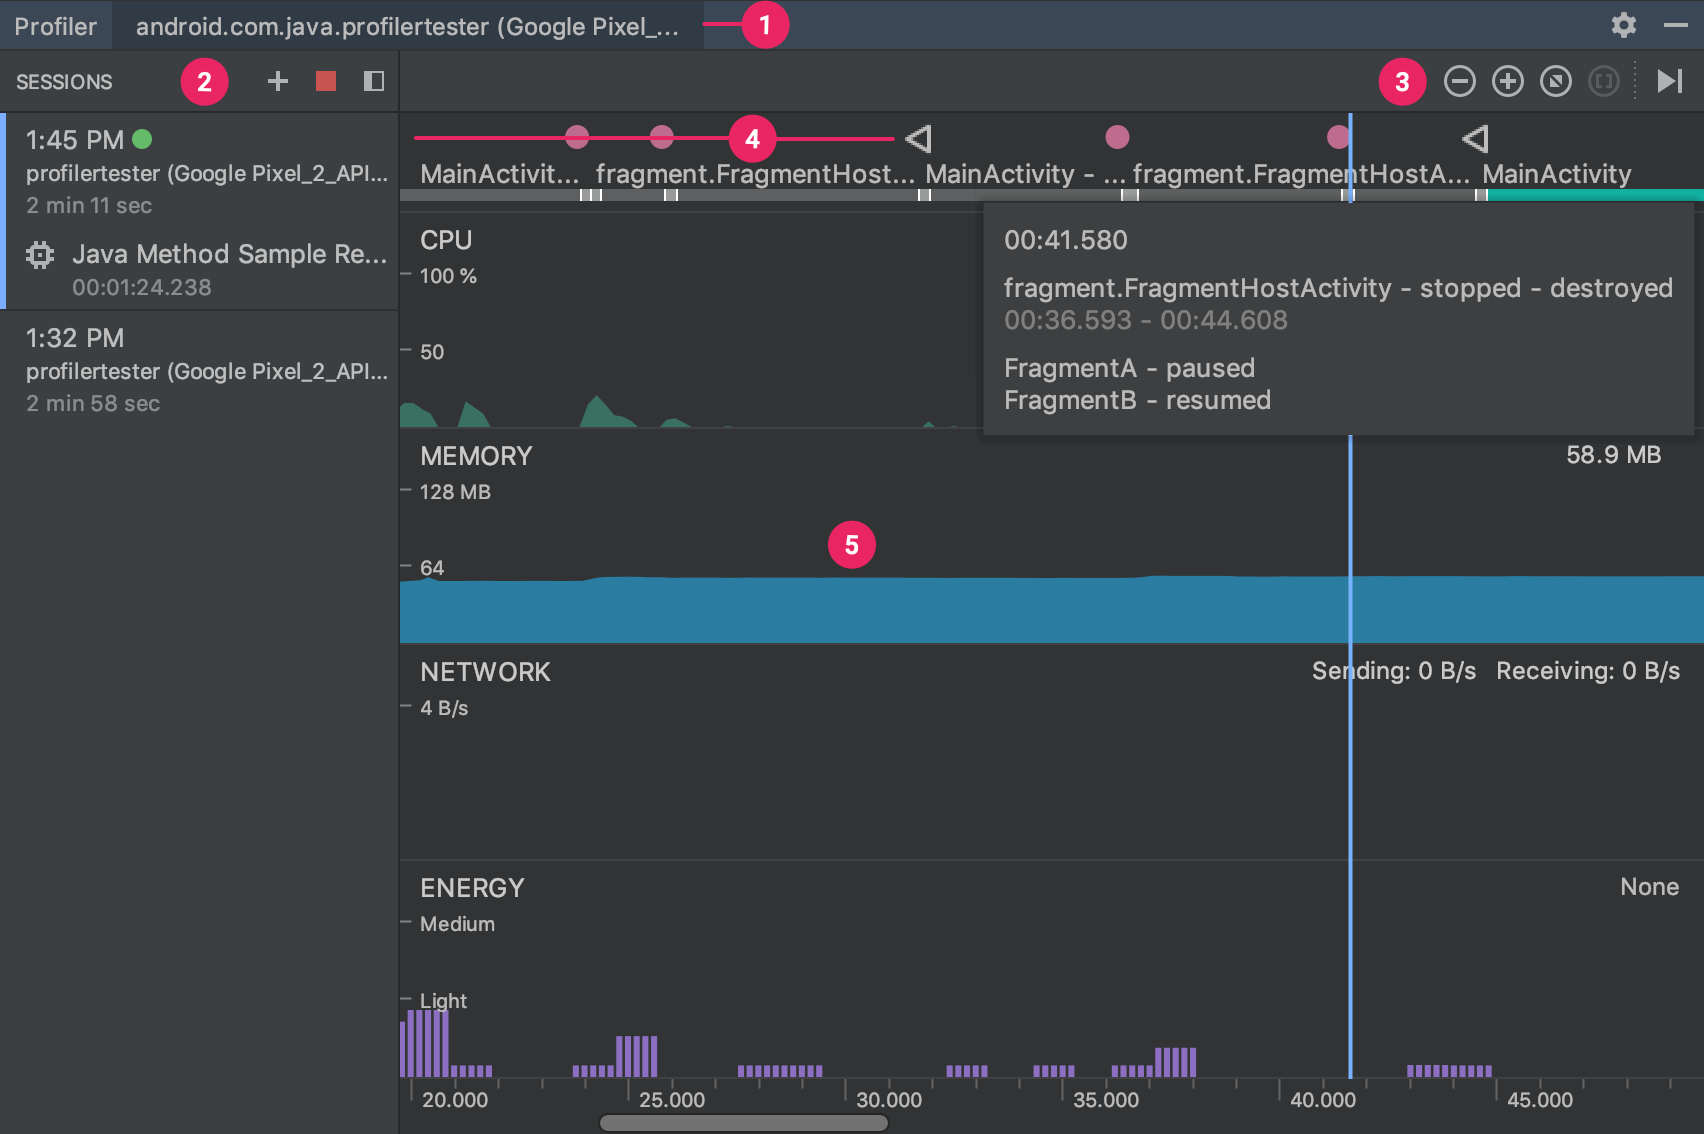
Figure 1. The Android Profiler shared timeline view
This shared timeline view only shows the timeline graphs. To access the detailed profiling tools, click the graph that corresponds to the performance data you want to inspect. For example, to access tools to inspect the heap and track memory allocations, click the MEMORY graph. For more documentation about each of the profiling tools, see the following:
- Inspect CPU Activity and Method Traces with CPU Profiler
- Inspect the Java Heap and Memory Allocations with Memory Profiler
- Inspect Network Traffic with Network Profiler
However, not all profiling data is visible by default. If you see a message that says, "Advanced profiling is unavailable for the selected process," you need to enable advanced profiling in your run configuration.
Enable advanced profiling
To show you advanced profiling data when running a device with Android 7.1 or lower, Android Studio must inject monitoring logic into your compiled app. Features provided by advanced profiling include:
- The event timeline on all profiler windows
- The number of allocated objects in Memory Profiler
- Garbage collection events in Memory Profiler
- Details about all transmitted files in Network Profiler
To enable the advanced profiling, follow these steps:
- Select Run > Edit Configurations.
- Select your app module in the left pane.
- Click the Profiling tab, and then check Enable advanced profiling.
Now build and run your app again to access the complete set of profiling features. However, be aware that the advanced profiling configuration slows your build speed, so you should enable it only when you want to start profiling your app.
