Webpack is a module bundler. It allows you to build your modular application similarly to the way it is done with a combination of tools like Browserify and Gulp or Grunt.
In this blog post we actually won’t dive into how to get started with Webpack, as lots of great tutorials are available in the Webpack documentation. Instead we’d like to focus on debugging applications built with Webpack in WebStorm 11 EAP (that you can learn more about here).
![]()
Here’s our very simple app: it’s available on Github and is already fully configured.
We have a simple Webpack configuration file that describes how files in our app are compiled and bundled. To keep it simple we won’t use any additional Webpack loaders. Webpack would bundle all our JavaScript assets in a single file that we can use in our app:
|
1 2 3 4 5 6 7 |
module.exports = { entry: "./entry.js", output: { path: __dirname + "/build", filename: "bundle.js" } }; |
Now let’s see how we can debug our app.
Usually we just put the breakpoints in our files and hit debug. But here we have all files bundled by Webpack in one. How can WebStorm match our original files to the code that is actually executed? Source maps help us with that: they provide information about the source files built. To generate source maps with Webpack you need to add option to your configuration file:
|
1 |
devtool: "source-map" |
But there are still a couple of things that WebStorm needs to do:
- it needs to locate the directory with the Webpack output files (including source maps); and
- it needs to understand the paths to the source files specified in the source map and match them to their location in the project.
Doing any kind of “black magic” to guess these paths can actually slow down the start of the debug session and may work unpredictably on complex projects. Instead we recommend specifying the mappings in the JavaScript debug configuration:
- from the remote URL of the compiled script to its location in the project;
- from the URL of source (listed in a source map) to the local path in the project.
Configuring mappings is always required for debugging Webpack applications. When using other build tools you might also follow these steps, for example when you are using source maps and want to put breakpoints in events on page load.
So let’s go back to our example. First, let’s exclude build directory from the project. That way the IDE will preload the source maps from it, moreover, it won’t index these files on every build or won’t suggest you to navigate to them from your source files.
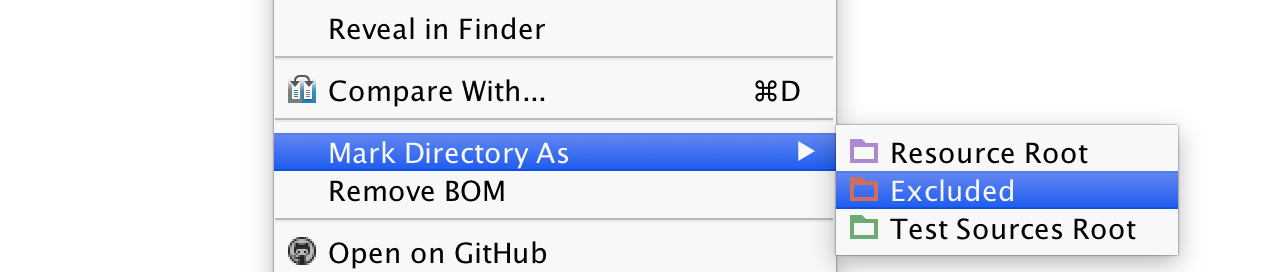
Right-click on the directory in the Project view and select Mark Directory As and then select Excluded.
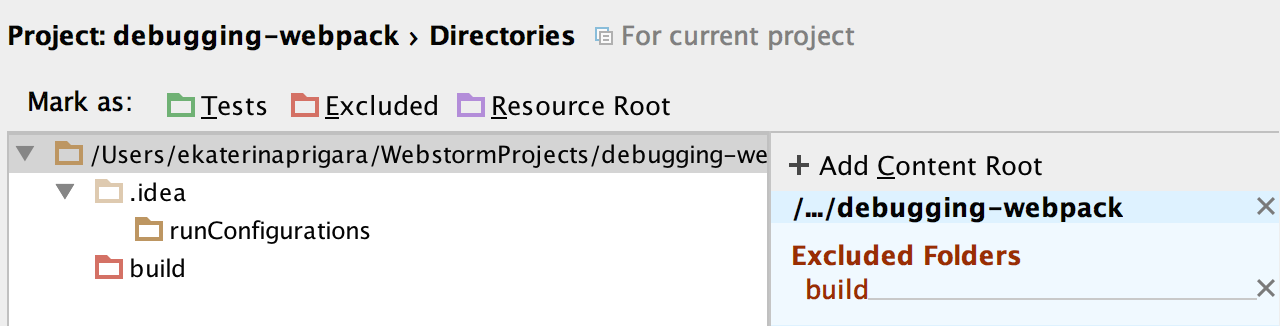
Or, go to Preferences | Project | Directories and exclude the directory from the project there:
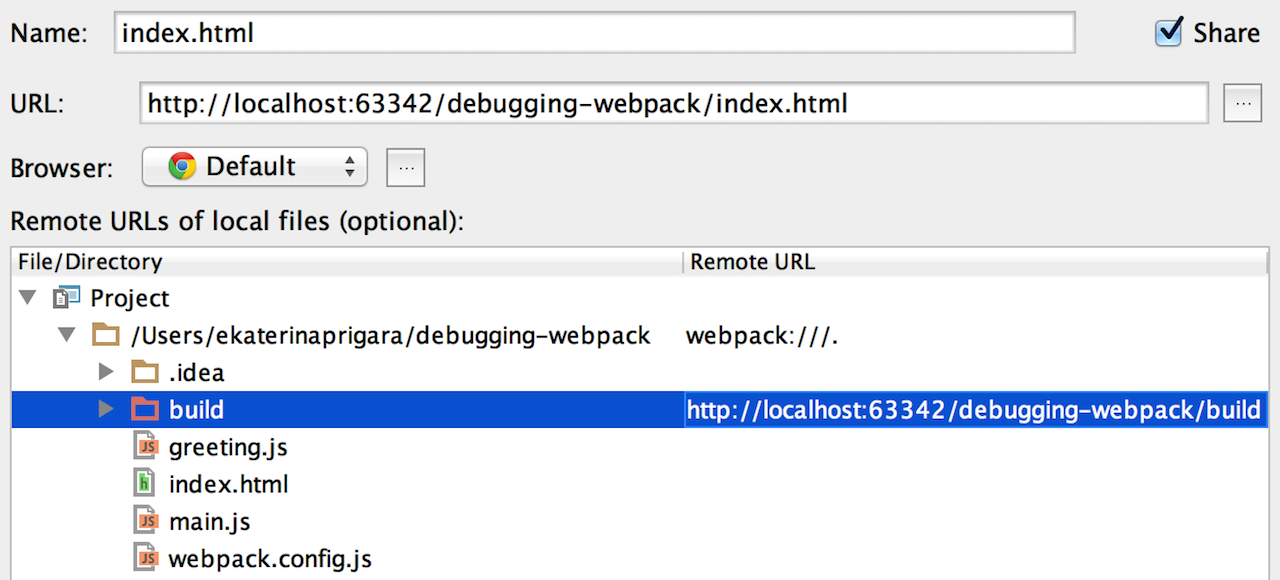
We run the application on the WebStorm built-in web server that uses the following structure of the URL: http://localhost:/ and then the path to the file from the project root. The post number can be changed in Preferences | Build, Execution, Deployment | Debugger.
So we can just map our local build directory to http://localhost:63342/debugging-webpack/build – the file paths from the project root match.
The next step requires us to map the URL that specifies the paths to local files in the source map. If we go to the Scripts tab in our Debugger tool window, we’ll notice webpack:///. folder – that’s actually a URL Webpack uses in its source map for the paths to the original files.

We need to map our application root to webpack:///.
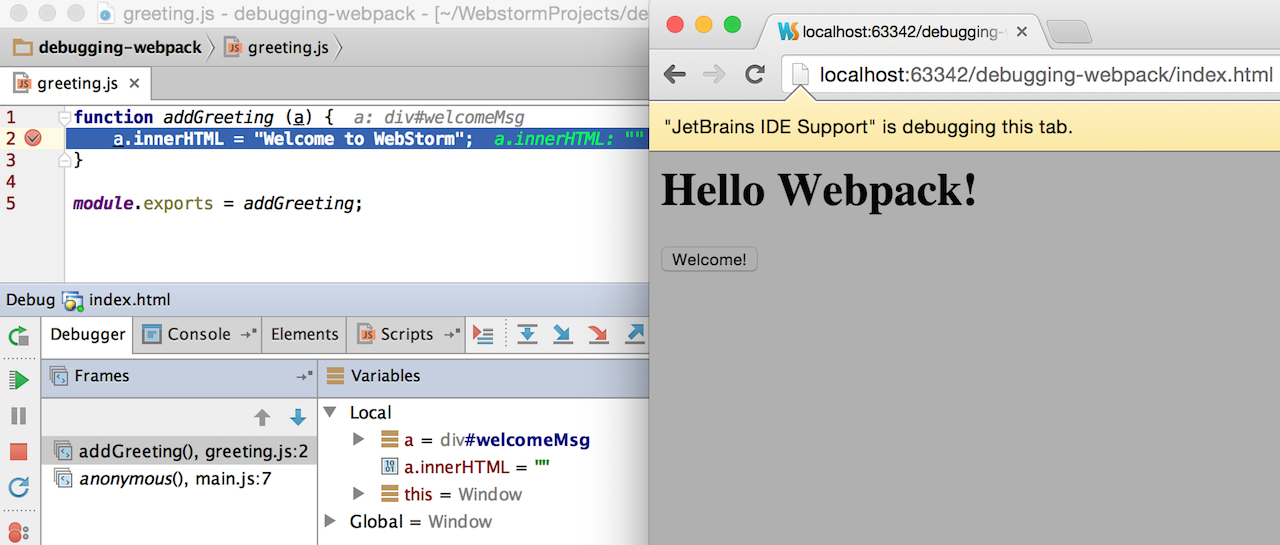
And now we’re ready to debug:
You may be wondering why all this can’t be done automatically. One reason is that at the moment WebStorm cannot detect whether you’re using Webpack or not and how exactly it’s configured. The main reason though is that, with the flexibility that you can have with such powerful tools like Webpack and more complex application structure, the mappings can get much more complicated. So we believe that a more configurable solution is better.
Develop with pleasure!
– JetBrains WebStorm Team
This is pretty sweet!
Any thoughts on creating a plugin for webpack (e.g. WebstormWebpackPlugin) that exposes the configuration you need to know to make it work? Instead of manually setting it up. It’d also allow you to add new features without relying on the user to change their config
Also (as I can’t edit…) any way you can resolve aliases and resolution within webpack to allow navigation to aliases during import et.al.?
We have some ideas on a plugin that would help to resolve the paths and aliases based on a runtime data (no way we can do that based on static code analysis), but unfortunately we won’t be able to implement it on time for WebStorm 11 release…
Can you provide tutorial for setting up such debugging with remote server (e.g. where server root points directly to build directory) and source maps are generated with other tools (in my case it’s browserify)?
Basically – make this tutorial more generic.
The main idea is the same: you need to set up mappings from the remote URL of the compiled script to its location in the project and from the URL of source (listed in a source map) to the local path in the project.
Please note that unfortunately we have some known issues about debugging projects with source maps generated by Browserify: https://youtrack.jetbrains.com/issue/WEB-14454
Thanks for the tutorial.
Just wondering how I get to the screen after this line:
“We need to map our application root to webpack:///.”
I can’t work out how to map the application root.
Thanks
That’s the screen of JavaScript debug configuration. You can create run configuration from the menu Run – Edit configurations…
How about source maps with webpack bundles for unit testing with Karma?
This is where source maps are really useful – testing.
There’s a related issue on our tracker: https://youtrack.jetbrains.com/issue/WEB-17256 I will ask my colleague responsible to have a look at it, probably the solution is already there. Would be great if you comment on the issue and provide a bit more details about your configuration. Thank you!
Will do. I have it partially working. However, I need to set an initial breakpoint in the bundle to get it to work.
Hey Peter, How did you get this to “partially” work?
Thanks for the tutorial. However, I don’t manage to get it set up all the way.
If I look in the Scripts-tab in Webstorm (OSX), I see webpack://, but under that there’s no ‘.’ folder, but the full path to Users/me/Projects/MyProject.
I can right click that to map it, and the entry appears in the debug configuration. I refreshed my browser, the debug connection and recompiled js and maps via Webpack. (My maps work fine in the Chrome debugger) But still the red debug dots stay plain when I click them, without a checkmark. So no breakpoints yet. Am I missing something?
I have filed issue https://youtrack.jetbrains.com/issue/WEB-19015 (vote&watch). As an workaround please specify webpack:///full path instead of just ” webpack:///.”
Is there some way to get debugging in Webstorm to work together with webpack hot realoading? It requires that we can use a web-serer with middleware, like express, but I think Webstorm insists on using it’s own webserver to debug?
https://www.npmjs.com/package/webpack-hot-middleware
WebStorm JavaScript debugger doesn’t require you to use a built-in debugger. In the configuration you can provide any URL, but you need to make sure you’ve configured the mappings. Haven’t tested the setup with the hotloader yet…
I cannot get debugging to work when using an express server with webpack-dev-middleware. If this scenario does not work, I’m afraid the debugging feature is no use because AFAIK nobody uses webpack in real-world development without either it’s built-in dev-server or the dev-server middleware. Could you please provide a git repo with an example that works with webpack’s dev-middleware? See URL below for details on how to set it up:
https://webpack.github.io/docs/webpack-dev-middleware.html
Please see https://youtrack.jetbrains.com/issue/WEB-19884
Thanks!
It should be noted that if you have a
node_modules/folder it needs to be mapped towebpack:///./~It should actually be webpack:///../~
it work fine,
could you give use a simple example with nodejs , the debugging not debug the sourcemap but the bundle file
thanks in advance
+1 for nodejs
The step where I could add path mappings, I can’t for node, because it’s not for the browser, therefore I can’t use the JavaScript Debug configuration
Unfortunately, at the moment you can’t debug Node.js app built with Webpack, I’lve reported an issue: https://youtrack.jetbrains.com/issue/WEB-19984
Please follow it for the updates.
Why not use Reactjs breakpoint debugging, using a simple js debugging is no problem.
Sorry, not sure I understand your problem correctly. Can you please report us an issue with the example? Thank you! https://youtrack.jetbrains.com/issues/WEB
I’m just wondering here, Do I need to build my entire project always that I need to debug? Can’t I debug in dev mode with debug enabled? Because just running with debug enabled without build the entire project I don’t have the build folder.
Could you help me?
Please see and vote for https://youtrack.jetbrains.com/issue/WEB-19884
I’m having a problem at this step “The next step requires us to map the URL that specifies the paths to local files in the source map. ” Is this process covered in one of your video tutorials?
I have it working reliably. I got instructions through https://youtrack.jetbrains.com/issue/WEB-20781 (Thanks, Ekaterina!)
I also decided to summarize the steps on my blog at: http://richb-hanover.com/debugging-webpack-apps-with-webstorm-2016-1/
Is there a possibility to get this work with typescript source, so I can set the breakpoints in my typescript files?